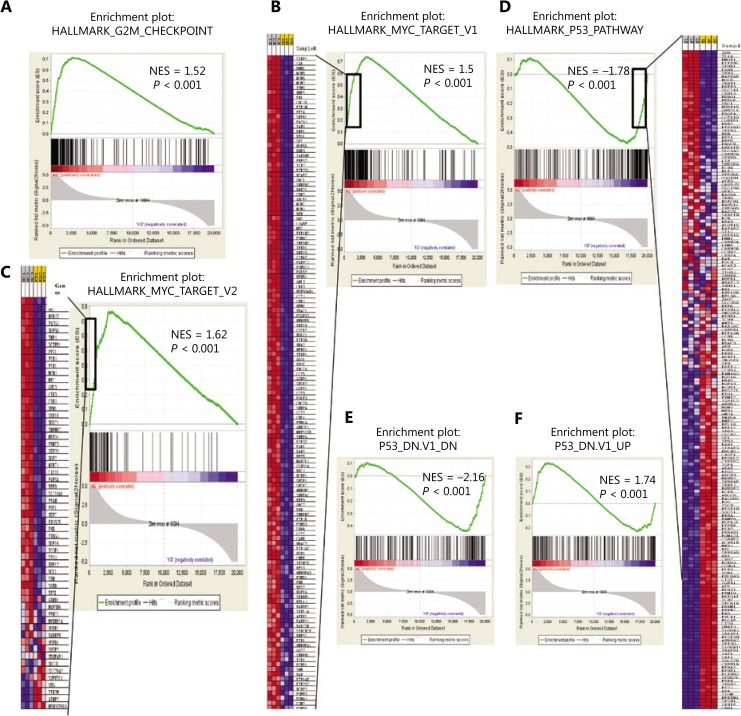
Figure 5.
Bioinformatics analysis indicated that SNRPG inhibition affected Myc and downstream p53. (A) Gene set enrichment analysis (GSEA) was performed with GSEA tools to determine whether particular gene sets were significantly enriched in differentially expressed genes regulated by SNRPG. The normalized enrichment scores (NES) are shown in the plot. The genes affected by silencing SNRPG in glioblastoma multiforme cells were enriched in the G2/M checkpoint pathway signature. (B–F) GSEA plot of the Cancer Genome Atlas gene signatures in shCtrl or shSNRPG glioma cells. Gene expression profile data were obtained by cDNA microarray using glioma cells expressing shCtrl or shSNRPG. The NES is shown in the plot. Further GSEA revealed that several gene set classifications, as annotated by GSEA collections, were significantly enriched. Specifically, SNRPG inhibition could cause significant Myc inhibition (B–C) and p53 activation (D–F).

