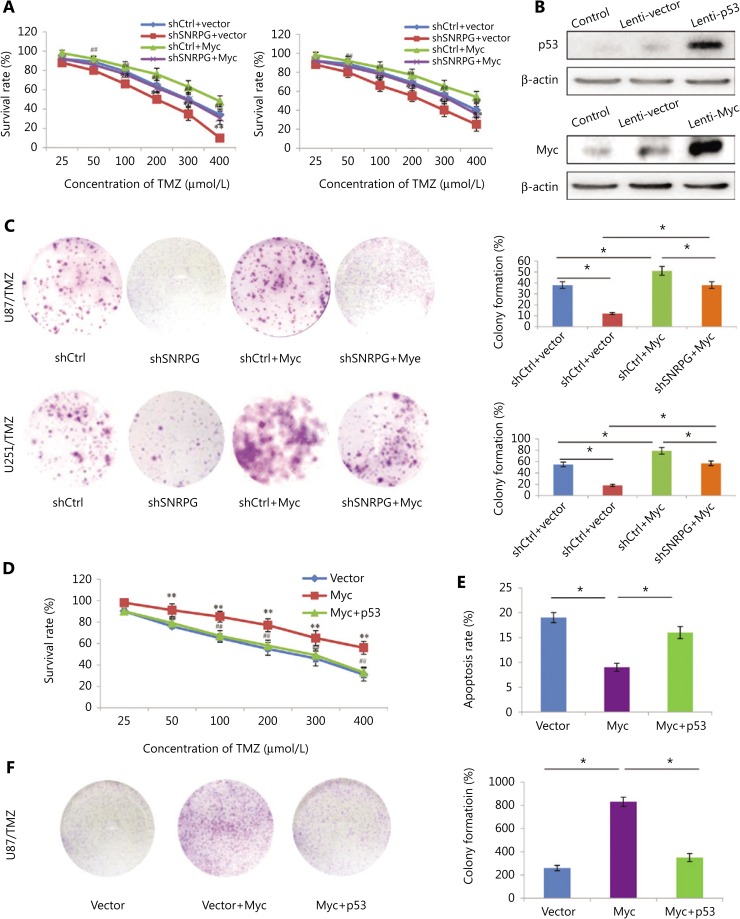
Figure 7.
Overexpression of Myc reverses the inhibitory effects of SNRPG downregulation, and activation of p53 signaling reverses the oncogenic effects of Myc in temozolomide-resistant glioblastoma multiforme cells. (A) The MTT assay was used to determine the cell viability after knocking down SNRPG and overexpressing Myc. The IC50 was determined in U87 (shCtrl + vector group: 297 μM; shSNRPG + vector group: 201 μM; shCtrl + Myc group: 372 μM; shSNRPG + Myc group: 289 μM), and U251 cells (shCtrl + vector group: 321 μM; shSNRPG + vector group: 226 μM; shCtrl + Myc group: 409 μM; shSNRPG + Myc group: 313 μM). *P < 0.05; **P < 0.01 vs. the shCtrl+vector group; ##P < 0.01 vs. the shSNRPG + vector group. (B) The Myc and p53 protein abundances in GBM cells, as indicated, were determined by immunoblot analysis. β-actin was used as the loading control. (C) A colony formation assay performed in the absence of TMZ was used to determine the cell growth after knocking down SNRPG and overexpressing Myc. The colonies were counted after staining with 0.1% crystal violet (Original magnification, 1×). (D) The MTT assay was used to determine the cell viability after Myc transfection and p53 overexpression (IC50 for Vector, 253 μM; IC50 for Myc, 497 μM; IC50 for Myc + p53, 295 μM). **P < 0.01 vs. the vector group; ##P < 0.01 vs. the Myc group. (E) An apoptosis assay was used to assess cell apoptosis after Myc transfection and p53 overexpression. *P < 0.05. (F) A colony formation assay was used to determine cell growth after Myc transfection and p53 overexpression. *P < 0.05. The colonies were counted after staining with 0.1% crystal violet (Original magnification, 1×).

