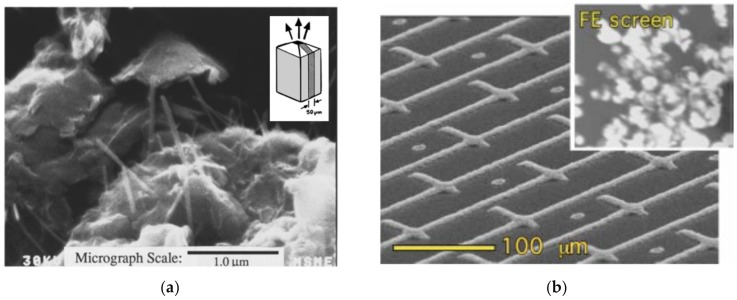
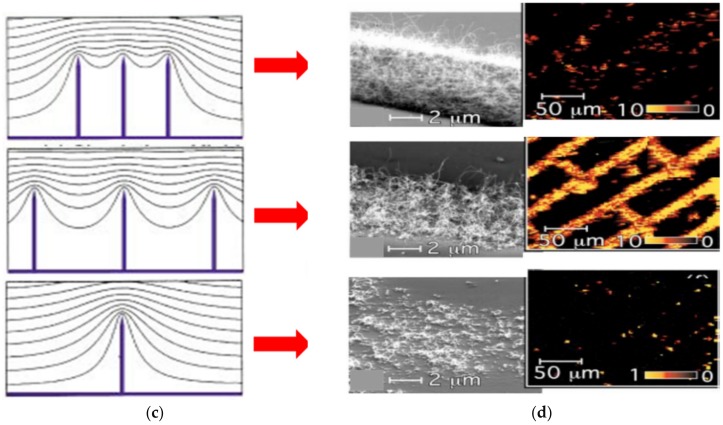
Figure 3.
The FE cathodes made of a CNT matrix: (a) an SEM image of the dispersed CNT laminated onto a 50 × 50 μm2 area, the inset—the schematic illustration presenting the CNTs matrix laminated between two glass slides (reprinted with permission from [86]); (b) an SEM image of FE cathode made by ink-jetting of dispersed CNTs—the inset presents a macroscopic emission image of 2.5 × 2.5 mm2 on the phosphor screen; (c) the illustration presenting the field screening effect issue—a simulation of the electric field penetration depth for various CNT inter-distances; (d) SEM images (left) and FE maps (right) of the FE film cathodes, relevant to simulations presented in (c)—from the top to the bottom: the FE film with the highest, medium, and the lowest density of CNTs. Figure 3b–d reprinted with permission from [85].


