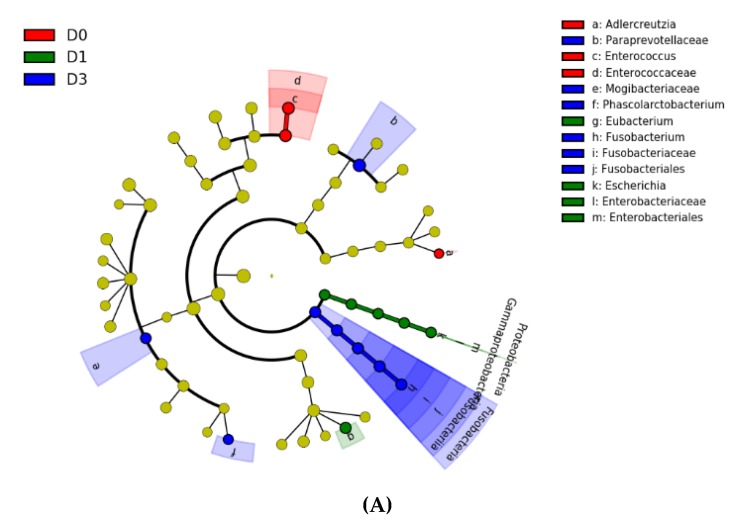
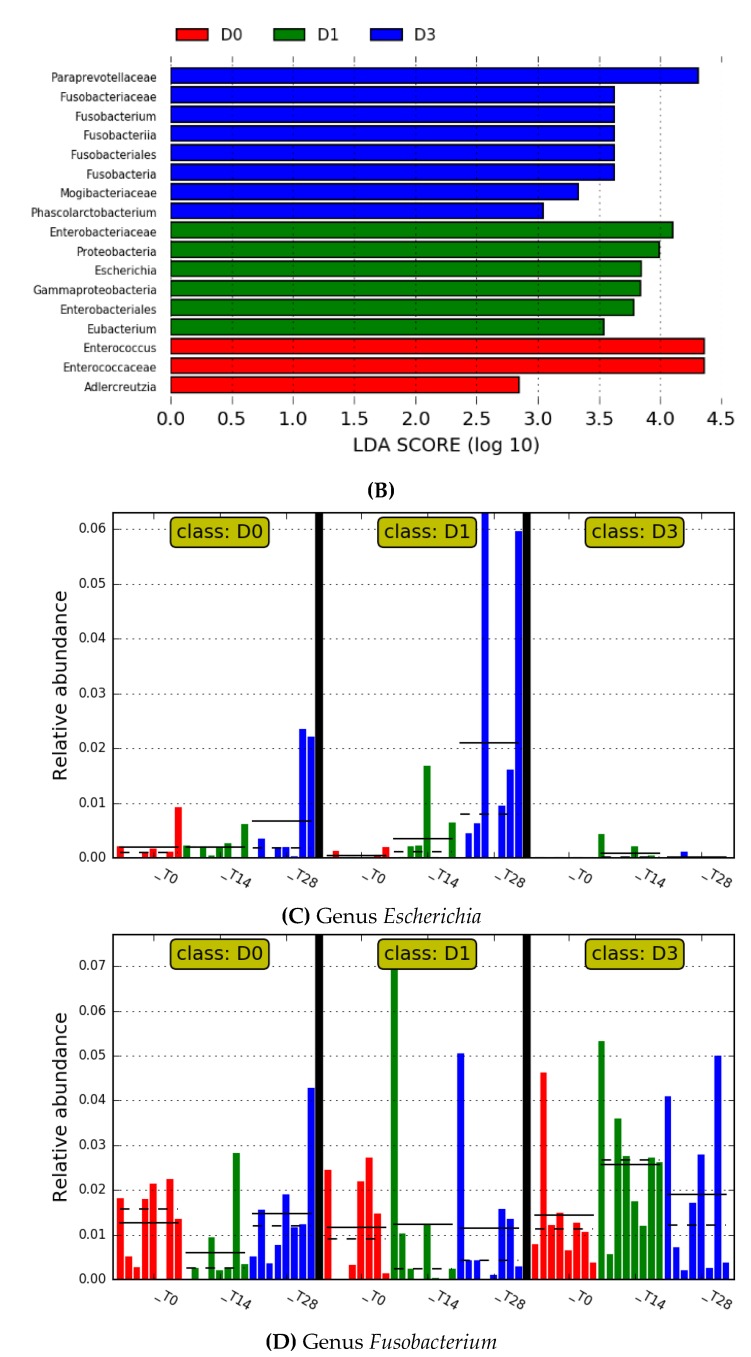
Figure 3.
Bacterial taxa differentially abundant in the feces of the dogs without administration of proanthocyanidins (D0), receiving a supplementation of 1 mg/kg live weight (D1) or 3 mg/kg live weight (D3) of proanthocyanidins. The cladogram in (A) highlights impactful communities within each treatment and (B) shows the score of the linear discriminant analysis (LDA, significant threshold > 2). (C) and (D) show the individual data for two of significant genera, where dotted line denotes the median and solid line the mean of each subgroup.


