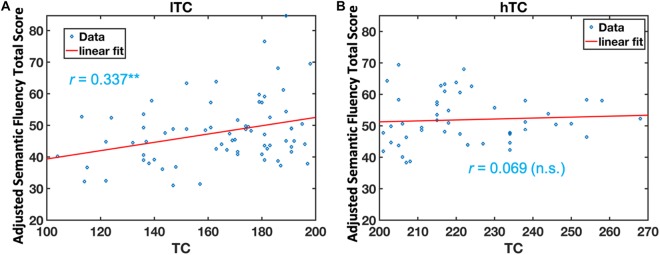
FIGURE 2.
The relationship between semantic fluency (SF) scores and total cholesterol (TC) in the low TC (lTC) and the high TC (hTC) group, separately. The adjusted SF total scores were significantly correlated with TC levels in the lTC group (r = 0.337, p < 0.01) (A), but not in the hTC group (r = 0.069, p > 0.05). (B) lTC group, participants with TC < 200 mg/dl; hTC group, participants with TC ≥ 200 mg/dl.

