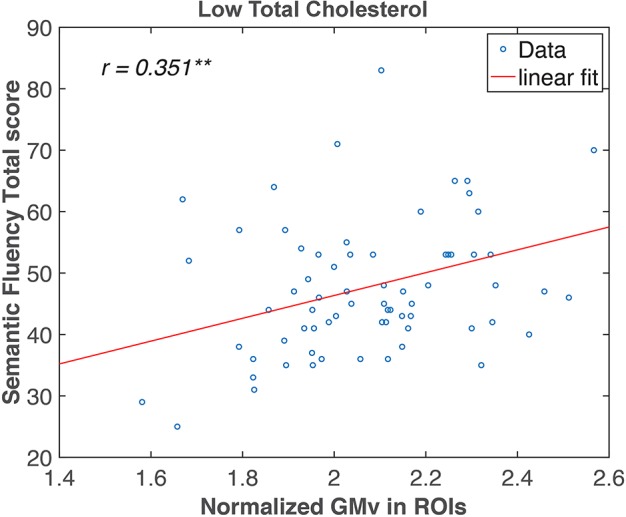
FIGURE 4.

Semantic fluency (SF) total score correlated with gray matter volume (GMv) in the medial temporal regions in the low total cholesterol (lTC) group. Pearson correlation analysis revealed a significant correlation between the normalized total GMv of the three clusters identified in Figure 3 and SF in the lTC group (r = 0.351, p < 0.01). ROI, region of interest. ** p < 0.01.
