Figure 3.
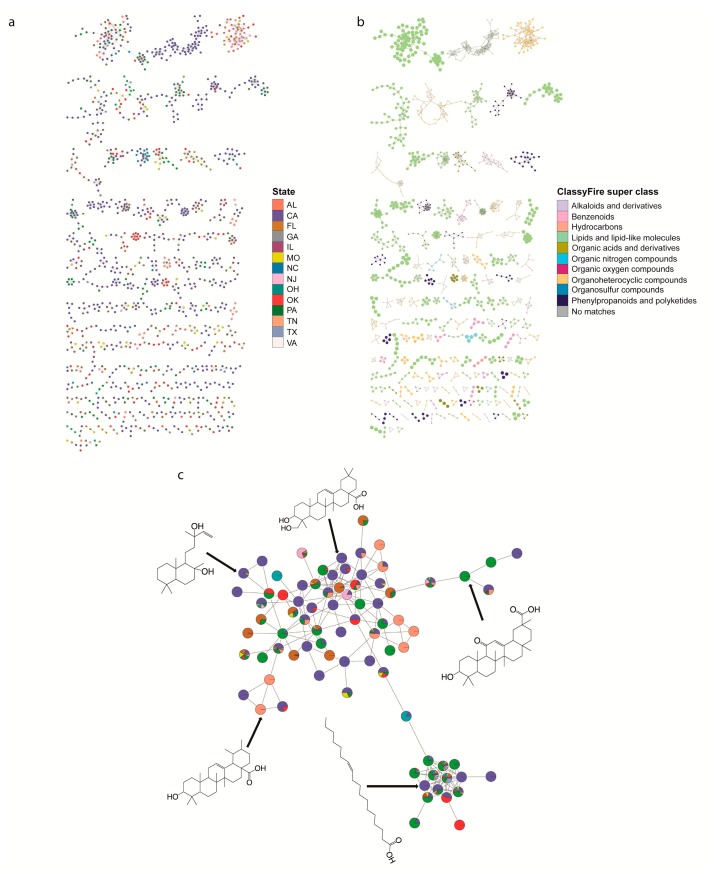
Chemical family analysis of backyard soil metabolites. (a) Feature-based molecular networking grouped metabolite features into 171 chemical families. Each node in the network represents one metabolite feature. Nodes connected to each other are structurally-related (cosine MS2 similarity score ≥0.7). Nodes are colored by the relative abundance of this metabolite feature between states. (b) Molecular network of soil samples colored by 13 selected chemical super classes as indicated in the legend. Node size based on the chemical classification scores for the ClassyFire super class. (c) Geographic heterogeneity in diterpenoid and triterpenoid family members. Nodes are colored by the relative abundance of this metabolite feature between states (colors as in panel (a)). Five structures of Global Natural Products Social Molecular Networking (GNPS) annotations for this subnetwork are displayed (level 2 annotation confidence [24]; ppm error <1; mass difference <0.001), with arrows pointing to the corresponding node.

