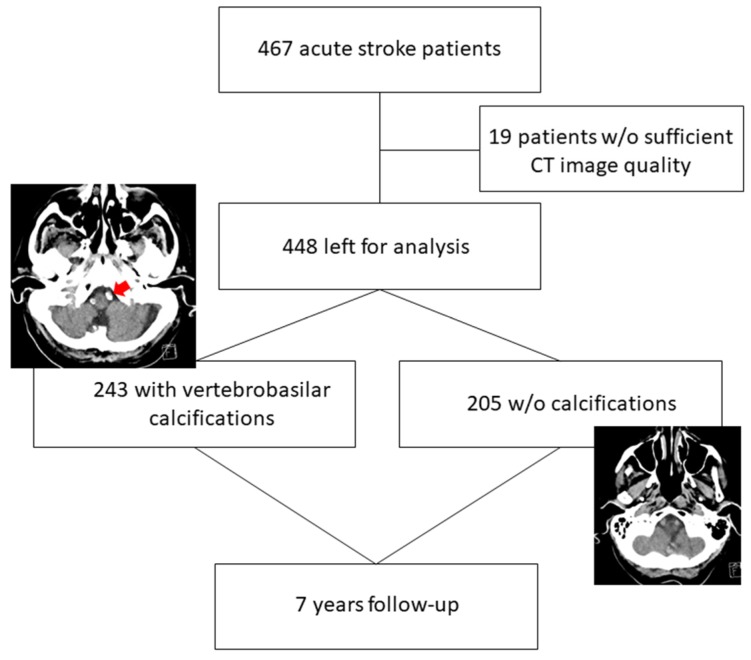
Figure 1.
Patient flow diagram during the 7-year study period. Left image: The red arrow depicts calcifications on nonenhanced brain computer tomography (NECT) in left (and right–not labelled) vertebral artery in an 89-year-old man with stroke (representative for the vertebrobasilar artery calcification (VBC) group). Right image: no calcification in vertebrobasilar vessels in an 88-year-old woman with stroke (control group, nonVBC).

