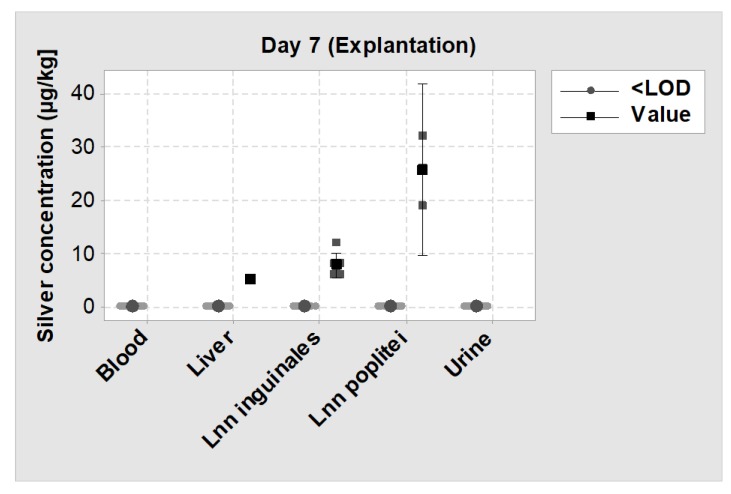
Figure 11.
Individual value plot of silver levels measured by inductively coupled plasma mass spectrometry (ICP-MS) on day 7 (explantation) in blood, urine, liver and two lymph nodes. <LOD = Silver concentration was below the detection limit; Value = Silver concentration could be measured. The big symbols represent the mean value of each group with a 95% confidence interval.

