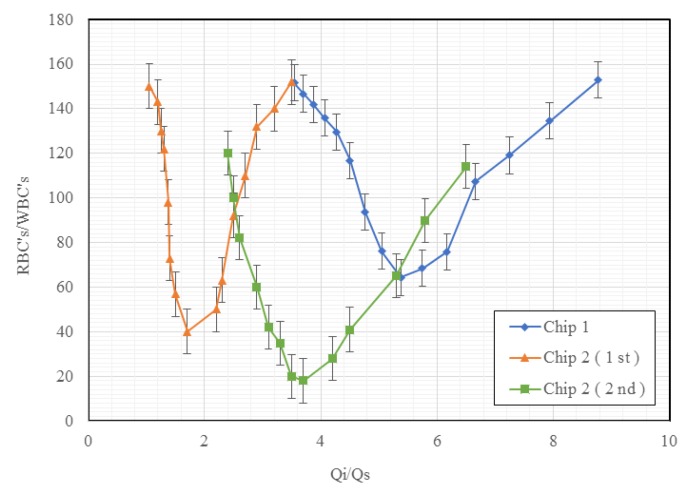
Figure 7.
Separation efficiencies to the ratio of injection (Qi) and suction (Qs) flow rates for Chip 1 and Chip 2. (Note: Chip 1 has no obstacle in the curve channels; Chip 2 has obstacles in the curve channels). (Note: Chip 2 (1st and 2nd) has two optimum, as the conditions of the blood samples vary between the 1st and 2nd tests.).

