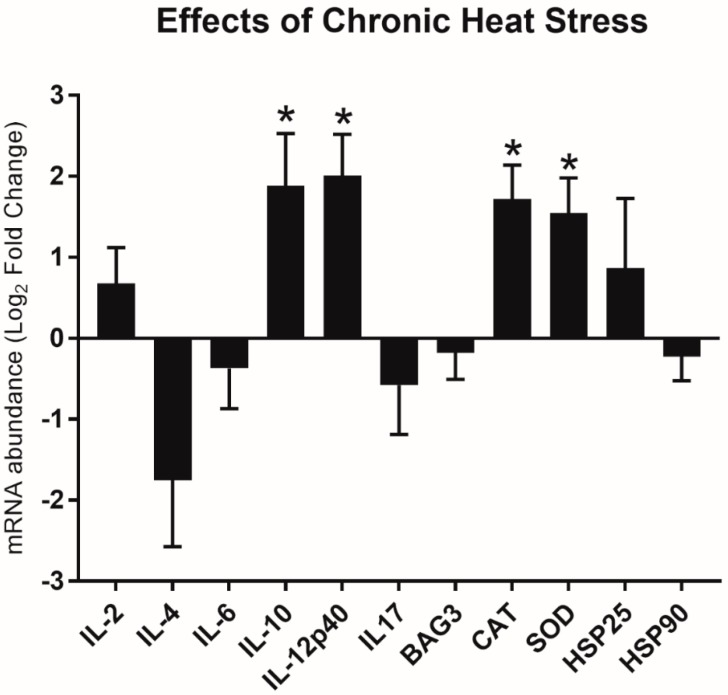
Figure 1.
Relative messenger RNA (mRNA) expression of immune-related and stress-related genes in the spleens of slow-growing chickens that were challenged with chronic heat. Gene panel includes: interleukin: IL-2, IL-4. IL-6, IL-10, IL-12p40, and IL-17 and stress-related genes: CAT, SOD, BAG3, HSP25 and HSP90. The x-axis shows a list of genes. The y-axis indicate the relative mRNA abundance of the genes after heat challenge (n = 8). Gene expression analysis was carried out with RT-qPCR. qPCR reactions were performed in triplicate. The geometric mean of the ACTB and UB reference genes was used to calculate delta cycle threshold (dCt) values. The relative gene expression (FC—fold change) was calculated with the delta delta cycle threshold (ddCt) formula and the fold change (FC) was calculated as follows: FC = 2−ΔΔCt. FC values were transformed and presented as Log2FC. The standard error of the means (SEM) shows distribution of the Ct values. Normalized data (dCt values) of thermoneutral control (mock-injected) and heat-stressed control (mock-injected) groups were compared with a Student’s t-test. Significant differences (p < 0.05) are labelled with an asterisk (*). Figures were prepared by using GraphPad Prism 7 (GraphPad, La Jolla, CA, USA).

