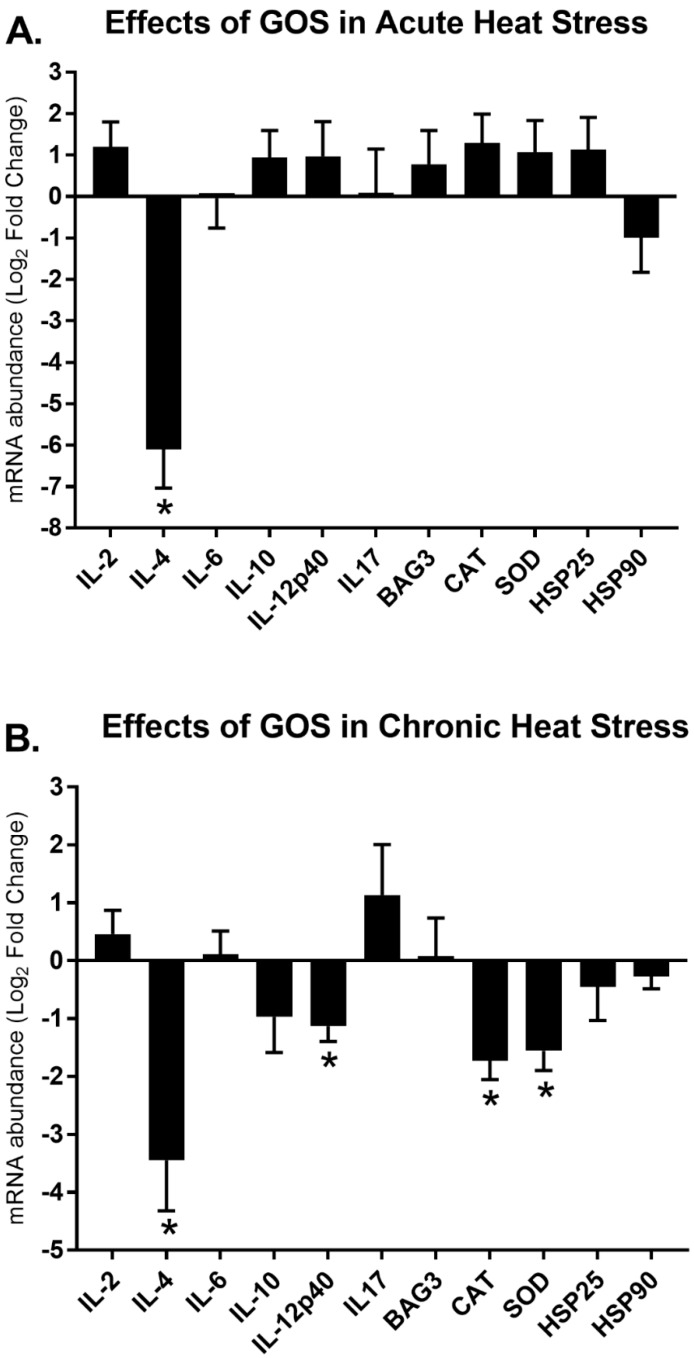
Figure 2.
Relative mRNA expression of immune-related and stress-related genes in the spleens of slow-growing chickens injected in ovo with GOS and challenged with heat on two levels: A—acute (30 °C for 8.5 h); and B—chronic (30 °C for 14 days). Gene panel includes: interleukin: IL-2, IL-4. IL-6, IL-10, IL-12p40, IL-17 and stress-related genes: CAT, SOD, BAG3, HSP25 and HSP90. X-axis shows a list of genes. Y-axis indicate relative mRNA abundance of the genes after heat challenge (n = 8). Gene expression analysis was carried out with RT-qPCR. qPCR reactions were performed in triplicates. Geometric mean of ACTB and UB reference genes was used to calculate dCt values. The relative gene expression was calculated with ddCt formula (FC = 2−ΔΔCt). FC values were transformed and presented as Log2FC. Standard error of the means (SEM) shows distribution of the Ct values. Normalized data (dCt values) of heat-challenged (A-acute, B-chronic) control (mock-injected) and heat-stressed GOS treatment groups were compared with Student’s t-test. Significant differences (p < 0.05) were labelled with an asterisk (*). Figures were prepared by using GraphPad Prism 7 (GraphPad, La Jolla, CA, USA).

