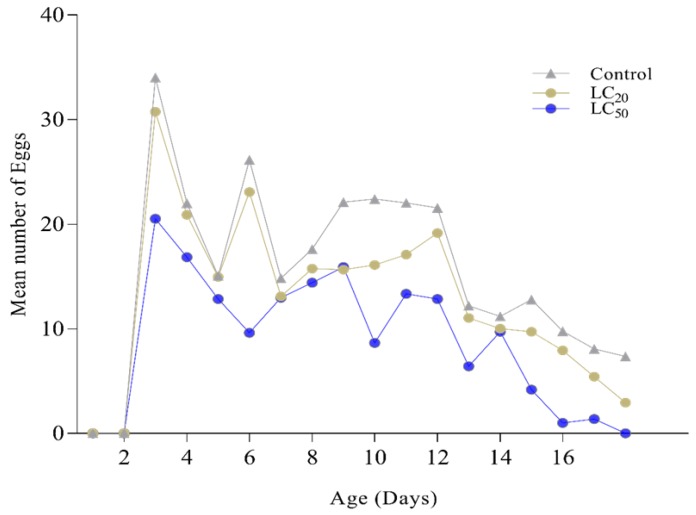
Figure 6.
Daily mean number of eggs from Ae. albopictus after treatment with Beauveria bassiana at LC20 and LC50 doses. The figure is showing the daily reproduction rate of females, where the control group is represented with the gray color line while sub-lethal (LC20) and lethal (LC50) concentrations of B. bassiana selected isolate (Bb-01) are presented with yellow and blue colors lines respectively.

