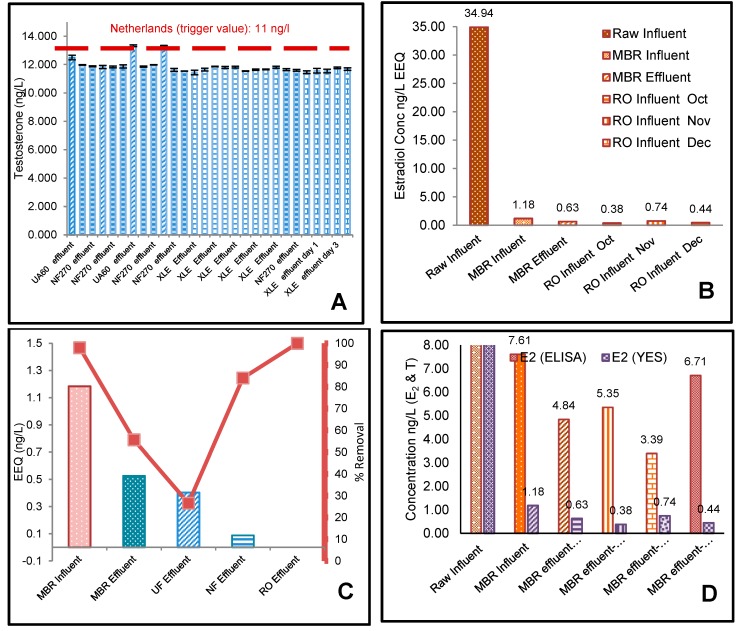
Figure 5.
17β-Estradiol (E2) and testosterone (T) measured activity in collected samples from raw MWWTW and MBR influents as well as MBR effluents at six stages over three months, along with the percentage removal comparing the UF/NF/RO performance accordingly. (A) The ELISA mean of testosterone (T) levels (ng/L) measured of the effluents of the UF, NF, and RO membrane treatment at various pilot plant conditions. Error bars denote SD; n = 2. Error bars show maximum levels detected (Netherlands, 11ng/L trigger value for drinking water from Brand et al. (2013) [43]. (B) shows the E2 YES analysis during October, November, and December. (C) 17β-Estradiol (E2) levels (ng/L EEQs) measured in water collected from influents at five stages within the MWWTW including MBR and RO influent and effluent during summer (October, November, and December). (D) compares the ELISA and (YES) analysis results for E2.

