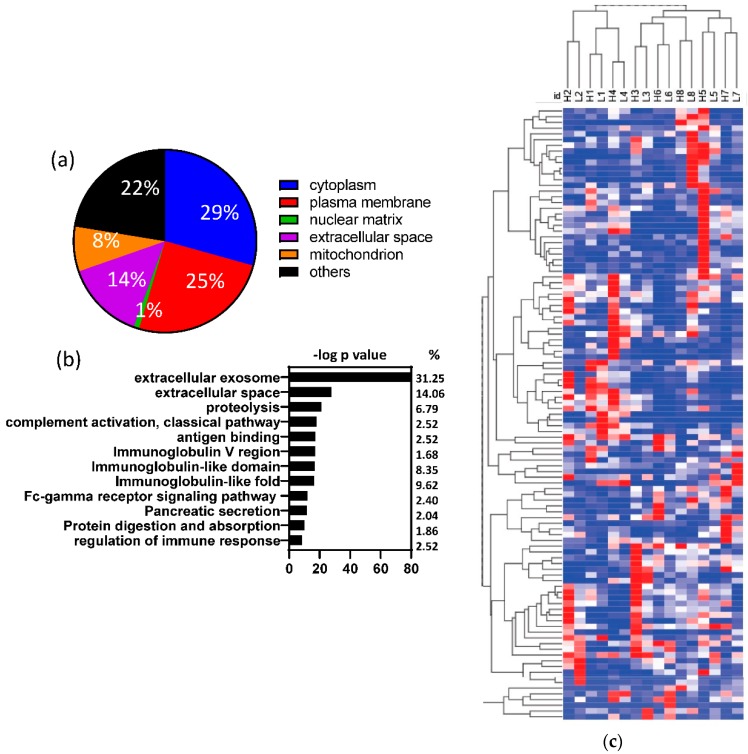
Figure 2.
Fecal human proteins were not significantly different between the diets. (a) Cellular location of the fecal human proteins; (b) Enrichment analysis of the fecal human proteins; (c) Hierarchical cluster analysis of fecal human proteins. The same participant on different diets clustered together based on their fecal human proteins. The number denotes the participant number; H = high glycemic load, RG diet; L = low glycemic load, WG diet; ns: non-significant.

