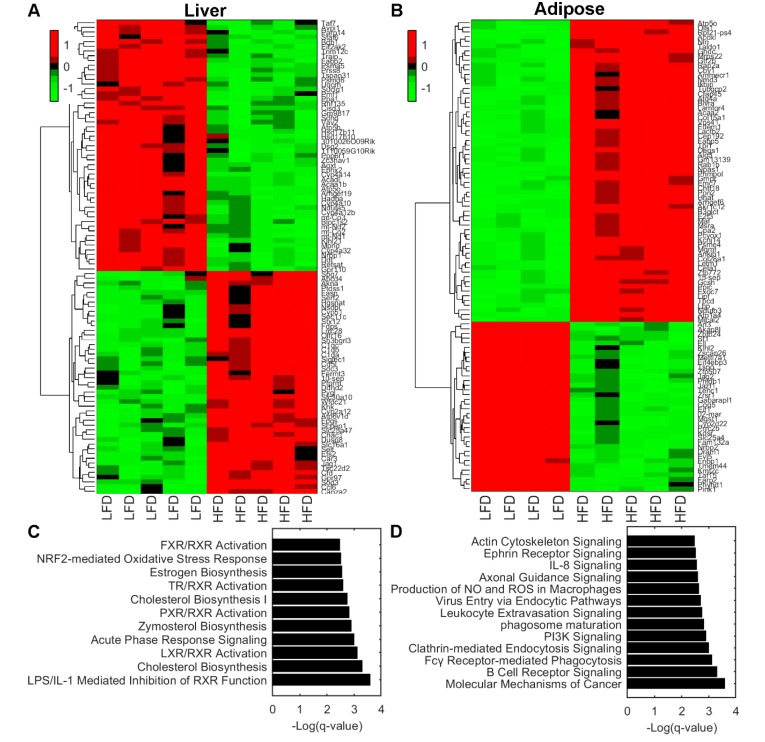
Figure 2.
(A,B) Hierarchical clustering of top 100 significant differentially expressed genes in liver tissue (A) and adipose tissue (B). (C,D) Pathway enrichment analysis using Ingenuity Pathways Analysis software of liver tissue (C) and adipose tissue (D). Statistical significance is expressed as q values of a right-tailed Fisher’s Exact test with multiple hypothesis correction based on the Benjamini–Hochberg approach. Abbreviations: LFD, low-fat diet; HFD, High-fat diet.

