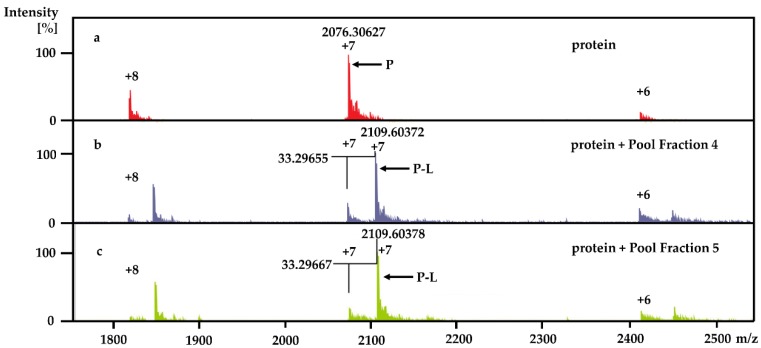
Figure 3.
Overlay of the native magnetic resonance mass spectrometry (MRMS) spectra for free Rv1466 (a) and Rv1466 incubated with Pool Fraction 4 (b) and 5 (c). In the spectrum of free Rv1466 (P), clusters of ions corresponding to three different charged states for Rv1466 were observed. The same cluster of ions was observed in the spectra with Pool Fraction 4 and 5 but at lower intensities. Accompanying the ions for free Rv1466 in the spectra with Pool Fractions are clusters of larger intensity ions shifted to high m/z values that correspond to Rv1466-ligand (P-L) complexes. The mass shift for the differently charged cluster pairs (P and P-L) was identical in both Pool Fractions, identifying the molecular weight of the bound ligand: Pool Fraction 4: MW = (2109.60372 – 2076.30627) × 7 = 233 Da; Pool fraction 5: MW = (2109.60378 – 2076.30627) × 7 = 233 Da.

