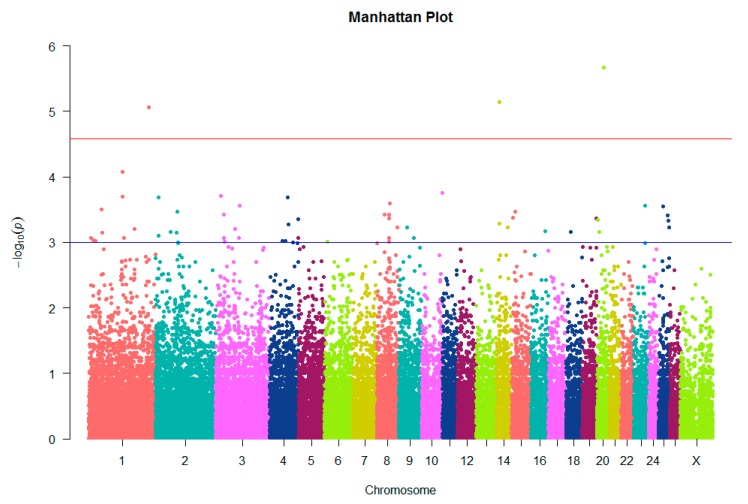
Figure 2.
Manhattan plot showing single-nucleotide polymorphisms (SNPs) associated with litter size on the ovine chromosome. The red line corresponds to the 5% chromosome-wide significance threshold using a Bonferroni correction (2.6 × 10⁻⁵). The blue line corresponds to a suggestive chromosome-wide threshold of 10−3.

