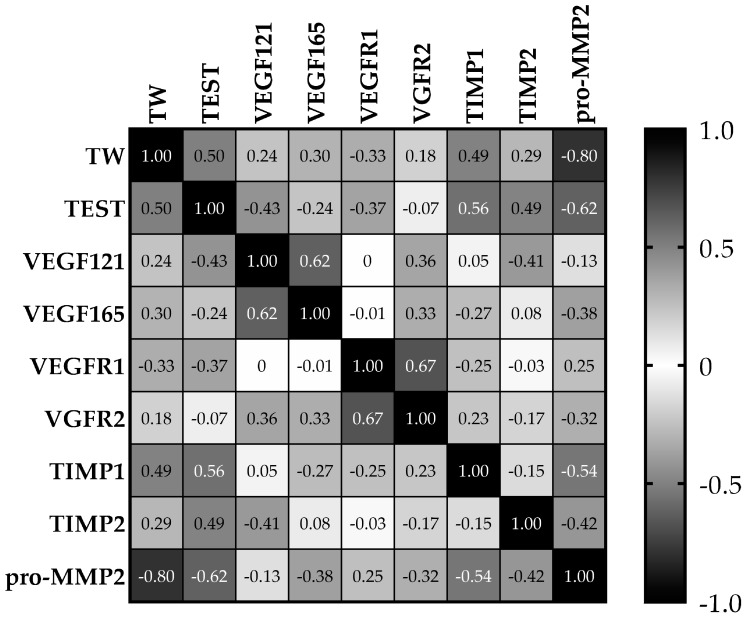
Figure 5.
Colour-coded Spearman rank correlation coefficients (ρ) table. Black squares indicate perfect correlations (ρ = 1 or −1 in case of perfect inverse correlation); white squares indicate that the two variables do not vary together (ρ = 0); gray gradients indicate different levels of correlation.

