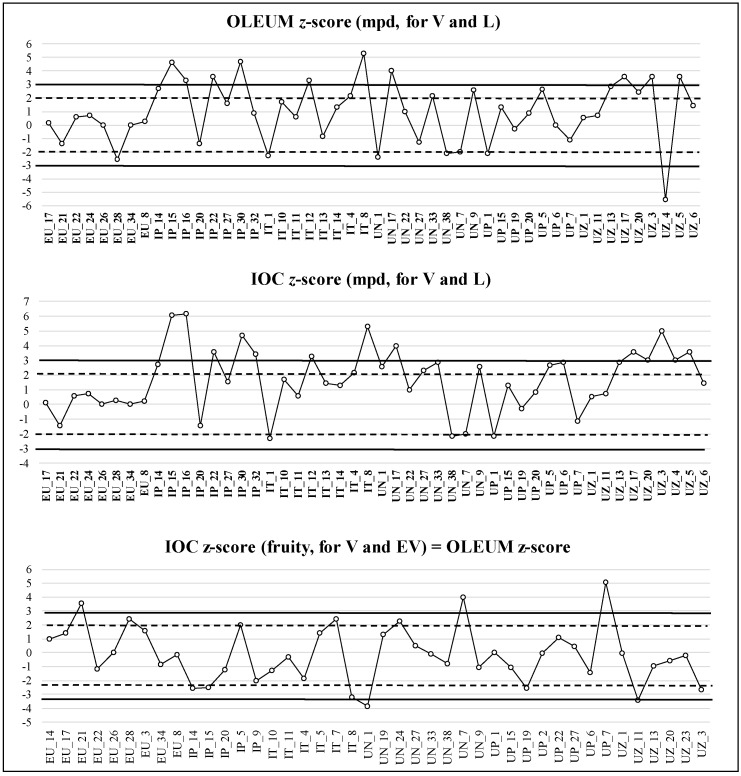
Figure 4.
Example of z-score graph for estimation of panel performance, calculated on 60 samples from the subgroup of the first sampling year (180 samples). Criteria of acceptance: |z| ≤ 2, performance was satisfactory; 2 < |z| ≤ 3, performance was questionable; |z| > 3, performance was considered unsatisfactory. The z-scores were calculated for median of the main perceived defect (for V and L category) and for the median of fruity attribute (for V and EV category).

