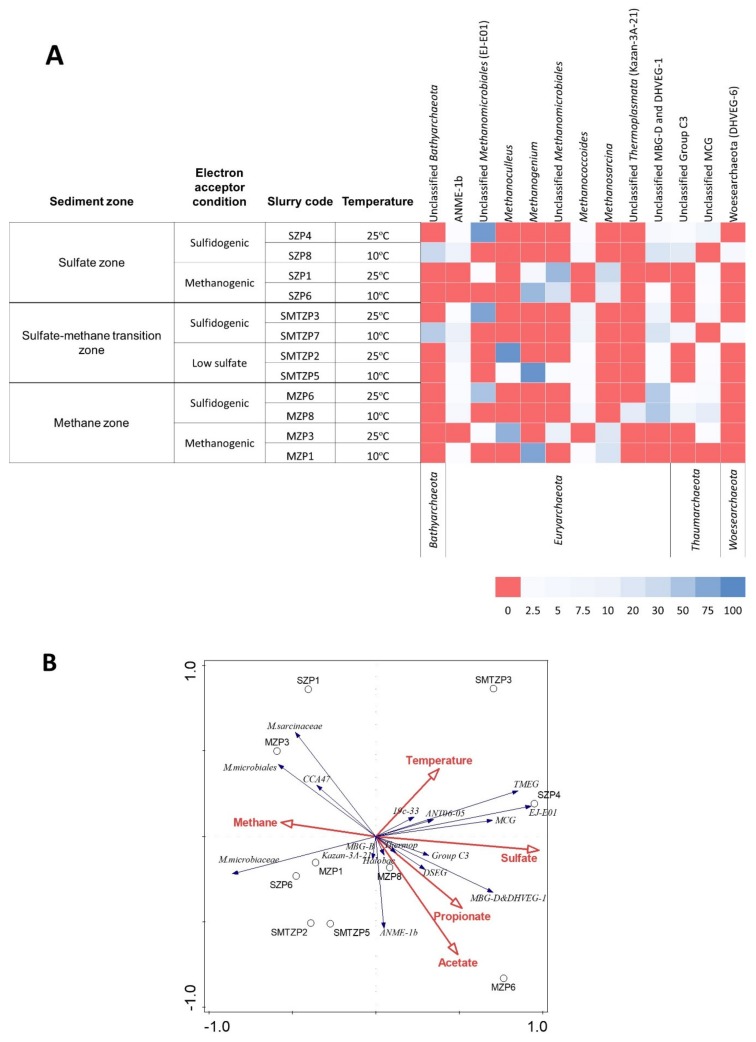
Figure 5.
(A) The heatmap depicts the relative abundance of the most common (>5 %) archaeal 16S rRNA gene sequences (unless unclassified) across the 12 slurries analyzed and sediment samples belonging to different biogeochemical zones. The heatmap colors represent the relative percentage of the archaeal assignments within each sample. Colors shifted towards dark red indicate higher abundance. (B) Redundancy Analysis Triplot showing relationship between archaeal community composition at family level and environmental parameters. Environmental variables are given as red vectors. Blue vectors represent archaeal families. Families were included with a relative abundance of at least 1% in any sample. Vector length gives the variance that can be explained by a particular environmental parameter. Perpendicular distance reflects association, with smaller distances indicating a larger association. Full names of the phylotypes in the plot are as followed: M.sarcinanaceae: Methanosarcinaceae; M.microbiales: Methanomicrobiales; M.microbiaceae: Methanomicrobiaceae; Halobac: Halobacteriales; Thermop: Thermoplasmatales.

