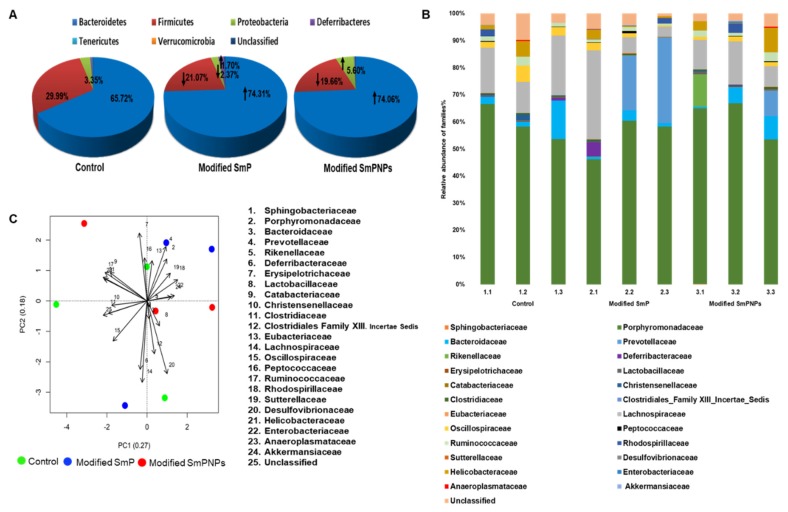
Figure 3.
Diet-specific changes of taxonomic composition of fecal microbial community of control, modified SmP, and modified SmPNPs treated mice. (A) Comparison of relative abundance of metagenomics based gut microbial phyla; (B) Comparison of relative abundance of metagenomics based gut microbial families; (C) Principal component analysis (PCA) of relative abundance of gut microbiota families. The percentage variance of PC1 and PC2 are represented in x and y axis, respectively, (Software version: R 3.6.1, packages. Vegan). (n = 4 per replicate, 3 replicates per each group).

