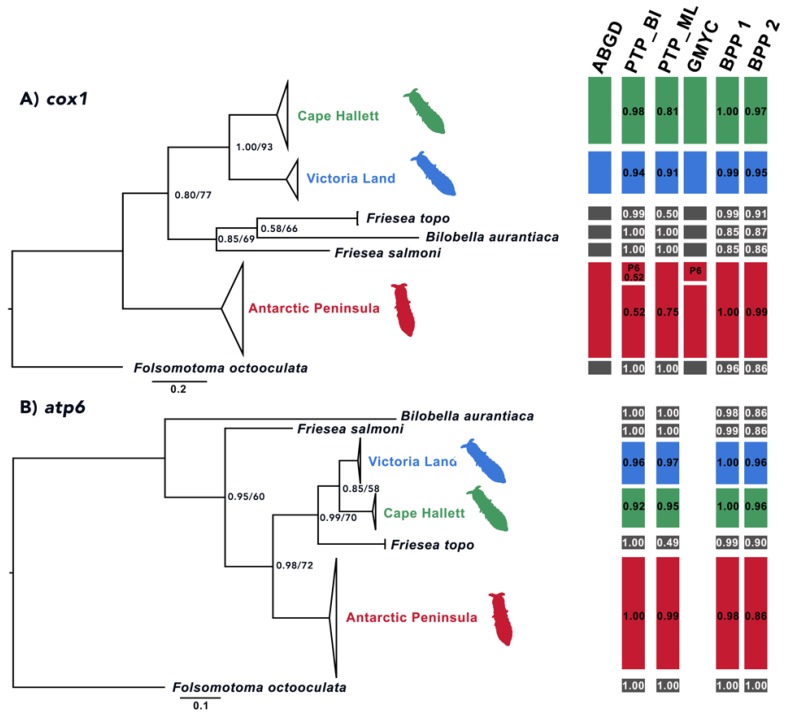
Figure 9.
The phylogenetic tree of the Friesea lineages under study obtained through Bayesian (BI) and maximum likelihood (ML) inference methods, applying the: (A) cytochrome c oxidase subunit one (cox1) dataset and (B) the ATP synthase subunit six (atp6) datasets. Bootstrap values/posterior probabilities indicated only when both do not correspond to maximum values. In red, the cluster of the 14 populations sampled along the Antarctic Peninsula; in blue, the phylogroup of the seven populations collected in Continental Antarctica and in green, the branch including six haplotypes from Cape Hallett. Outgroup species listed in black. On the right, a summary of the species delimitation methods performed on the single-locus dataset. Black boxes indicate the outgroup species, whereas red, blue and green identify samples from the alternative geographical regions (described as above). Applied methods of species delimitation listed above bars as follows: ABGD, automatic barcode gap discovery; PTP, Poisson tree process applying BI or ML topology, respectively, and including the outgroup species; GMYC, generalized mixed yule coalescent model and BPP, Bayesian phylogenetics and phylogeography, run with priors θ:G (1:10), τ:G (1:10) (BPP1) and θ:G (2:100), τ:G (2:500) (BPP2). For species distributions, see Discussion.

