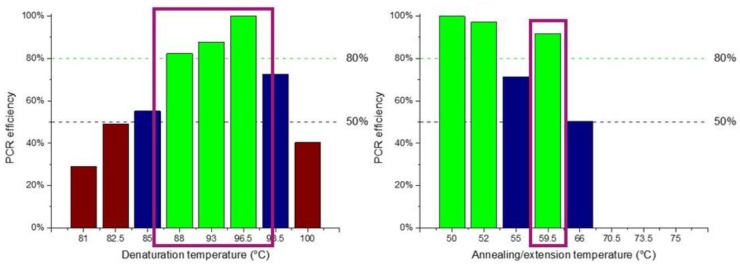
Figure 3.
PCR temperatures for optimal amplification efficiency following a two-temperature (2T) protocol. The bars represent band intensities on the gel normalized with the most intensive one (100%). Green, blue, and brown bars indicate temperature ranges achieving amplification efficiency higher than 80%, between 50 and 80%, and lower than 50%, respectively.

