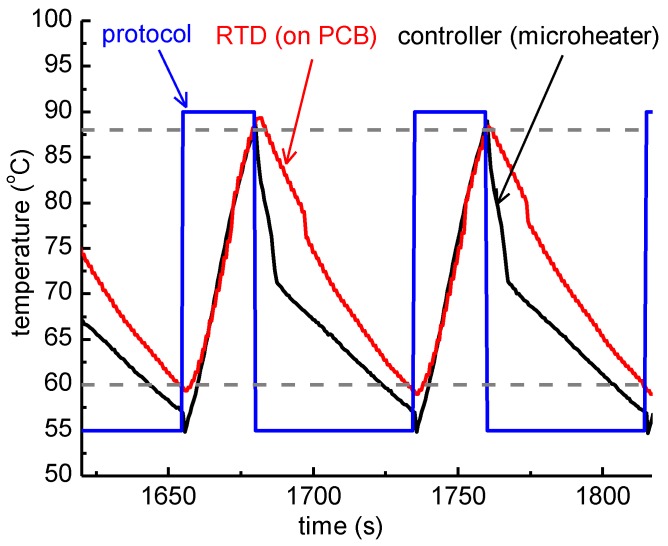
Figure 4.
Graphical representation of the temperature measured while running an actual 2T thermocycling experiment with a thick PCB microheater chip. The protocol followed by the temperature controller was 25 s at 90 °C followed by 55 s at 55 °C (blue line). The temperature of the microheaters, as obtained from their resistance values acquired by the temperature controller, and the temperature recorded by the resistance temperature detector (RTD), are also shown. The dashed lines correspond to 88 °C and 60 °C accordingly.

