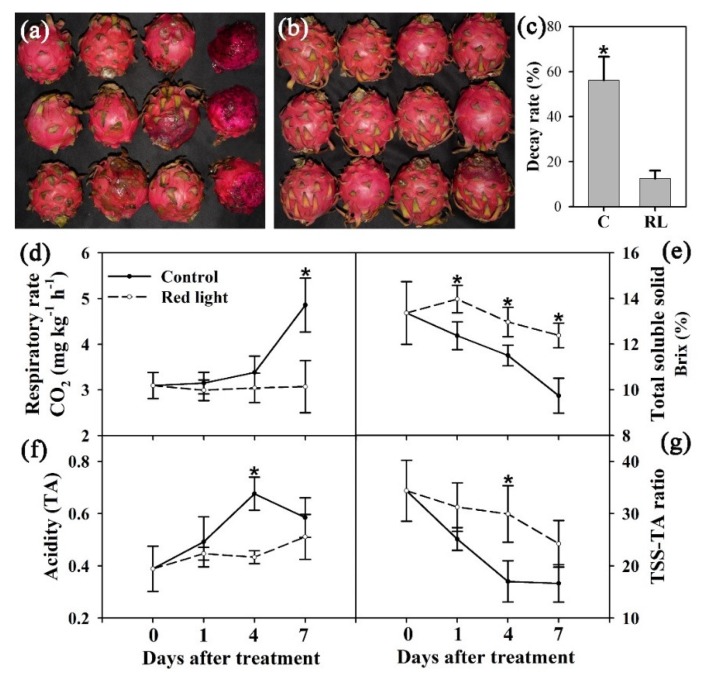
Figure 1.
The effects of red light on pitaya fruit. The decay rate of pitaya fruit was measured on Day 10; (a): control. (b): red light. (c): decay rate. Control fruit: C; red light-treated fruit: RL. (d): respiratory rate. (e): total soluble solid. (f): acidity. (g): ratio of total soluble solid/acidity. The * on the error bar indicated statistically significant differences (p < 0.05) between control and red light-treated samples.

