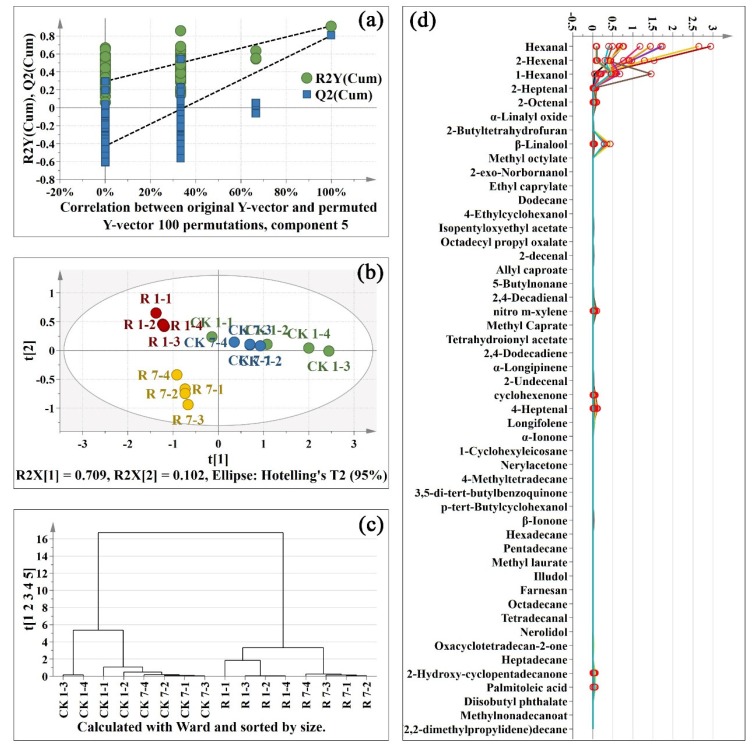
Figure 5.
PLS-DA of volatile compounds after red light irradiation; (a): permutations plot of PLS-DA; (b): score scatter plot of PLS-DA. (c): HAC plot of PLS-DA; (d): spectra plot of PLS-DA. CK: control sample. R: red light. 1-1: one replicate of 1 d sample; 7–2: one replicate of 7 d sample. There are four replicates per sample. The key volatiles in OPLS-DA were marked in red circles in Figure 5d.

