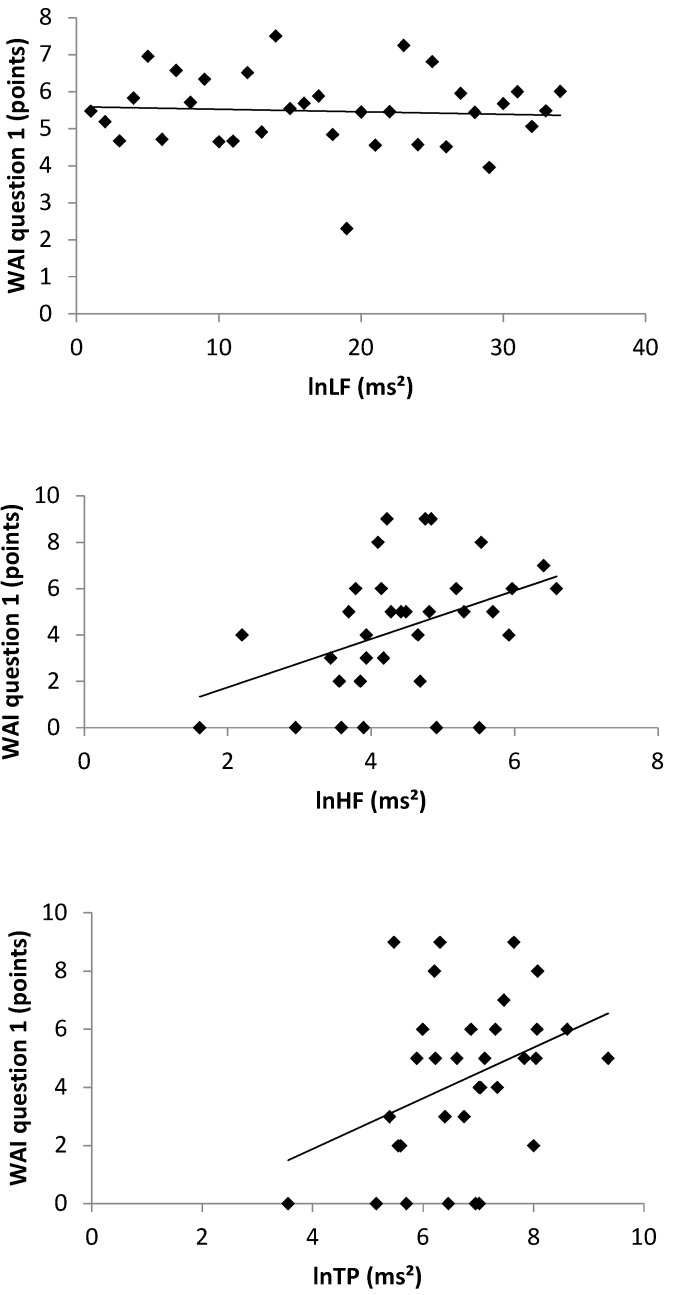
Figure 2.
Scatter diagrams between the self-perceived work ability (WAI question 1), lnLF, lnHF and lnTP with the corresponding regression lines. WAI: work ability index, lnLF: natural logarithm of the Low Frequency, lnHF: natural logarithm of the High Frequency, lnTP: natural logarithm of the Total Power.

