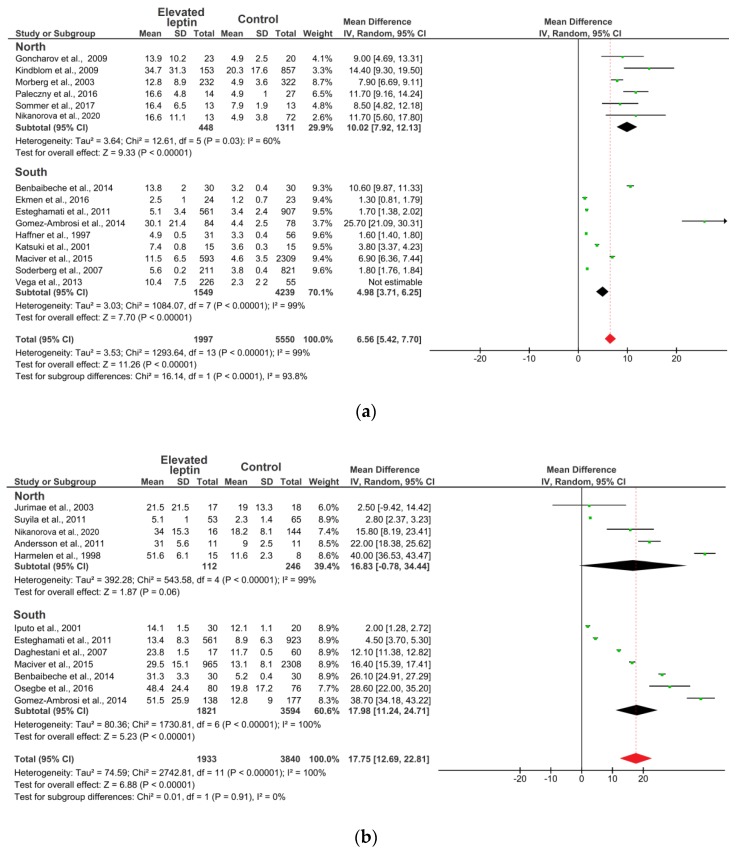
Figure 3.
Forest plot of meta-analysis: Mean difference in the circulating level of leptin in subjects with elevated leptin and controls: (a) males; (b) females. Note: Mean—average value; SD—standard deviation; Dotted line—the point estimate of the averaged studies; Black diamond—the point estimation; Red diamond—the average point estimation.

