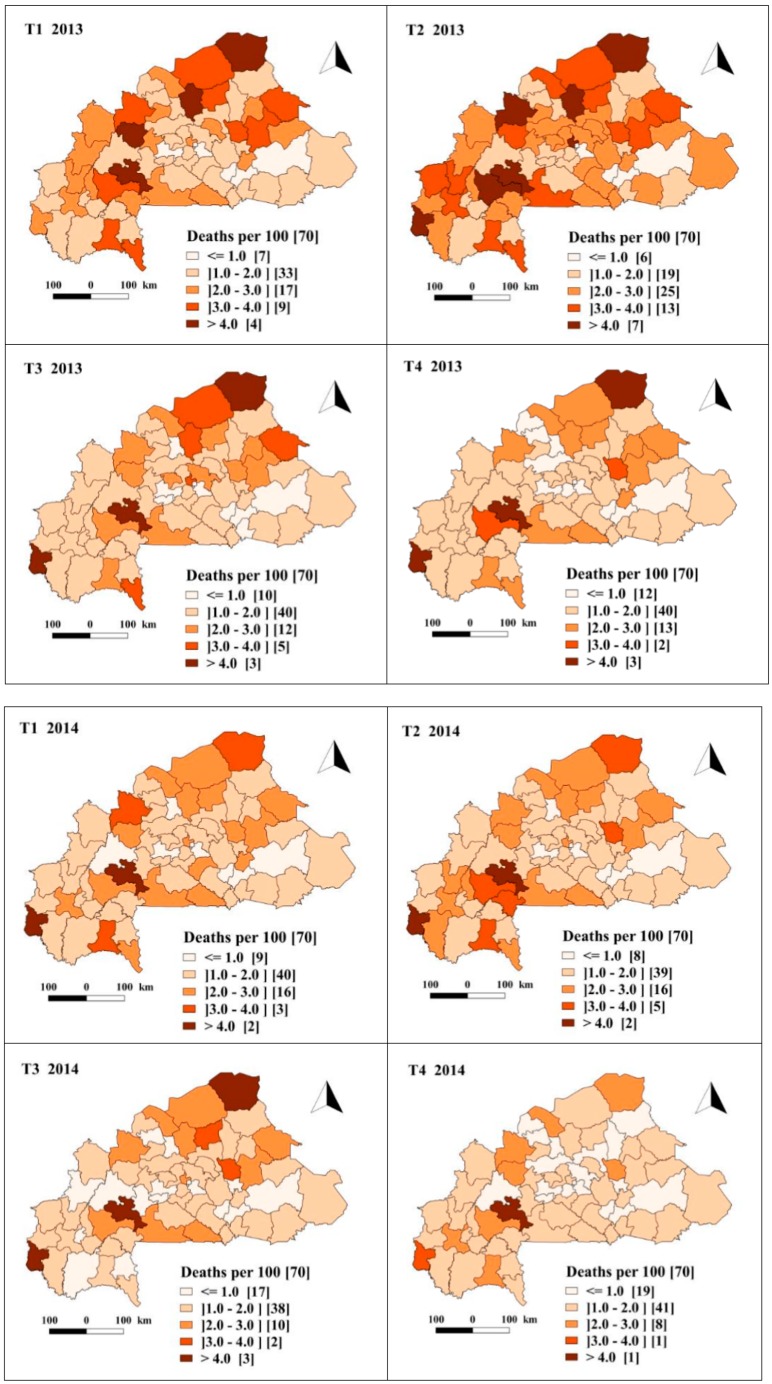
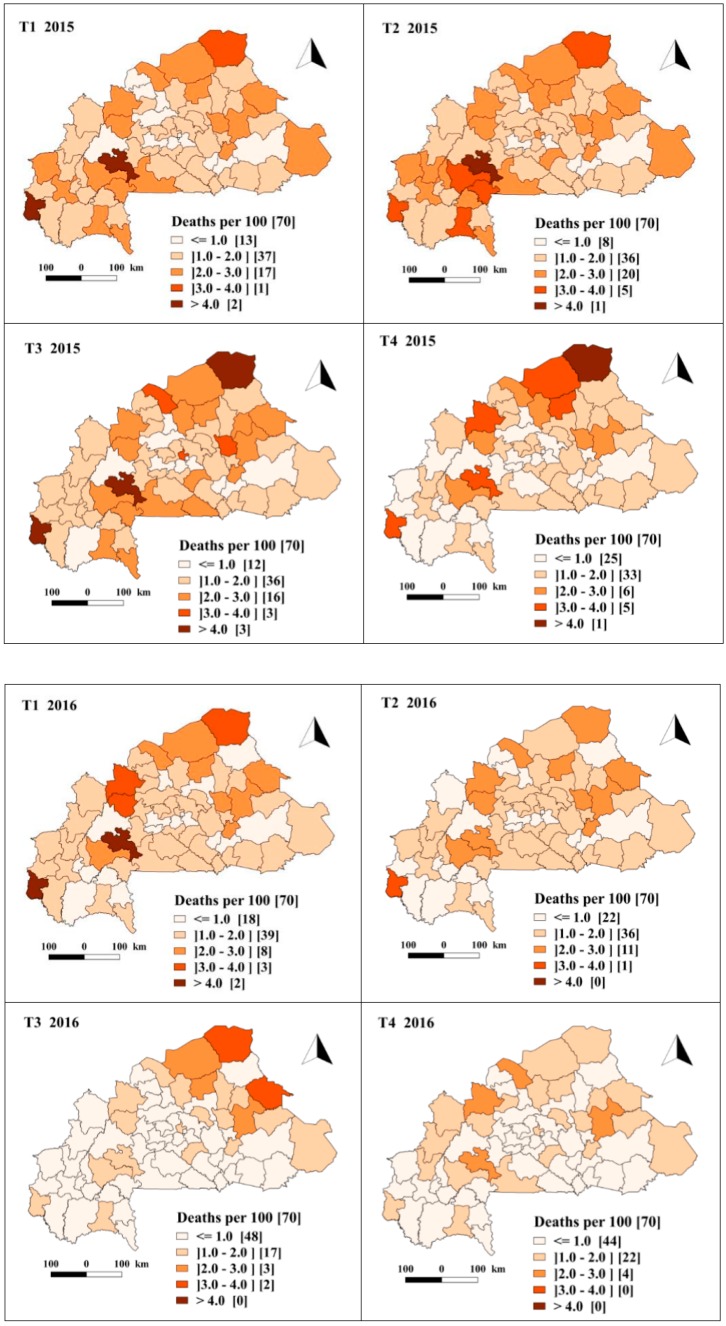
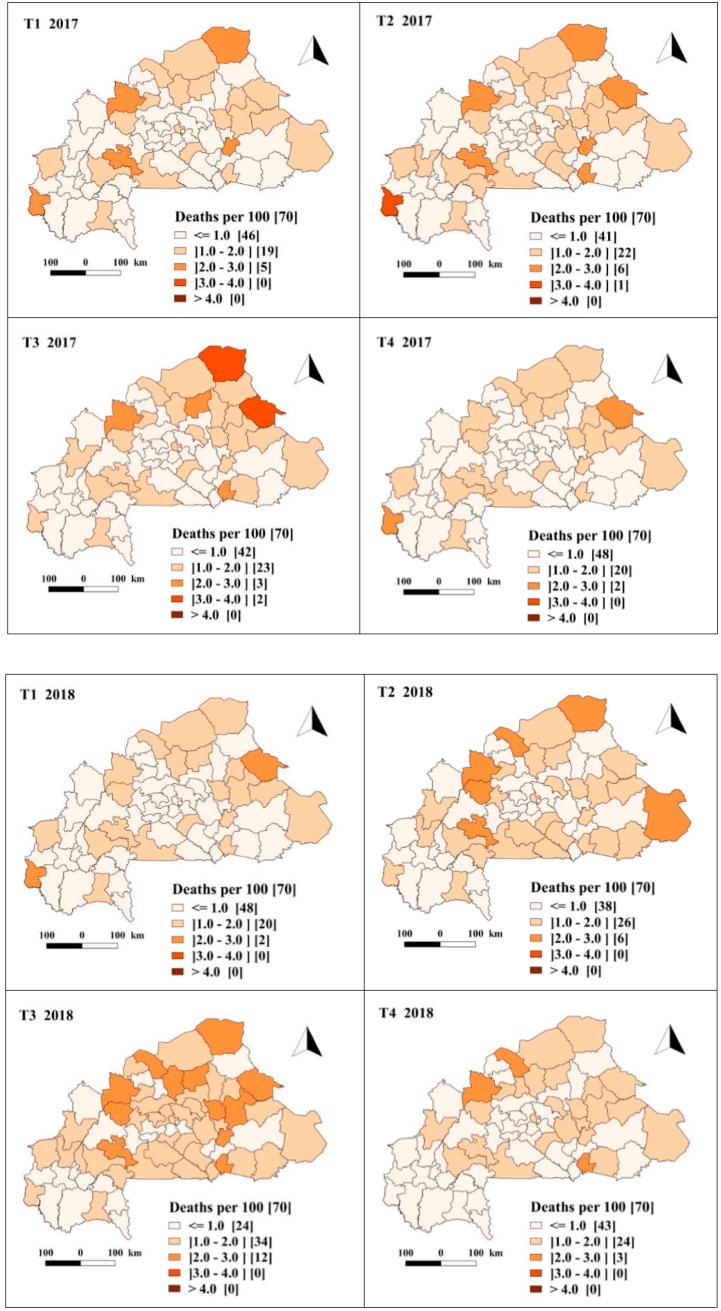
Figure 2.
Spatiotemporal trends in the predicted malaria case fatality rate per 100 severe malaria cases in children under five, estimated from the Bayesian spatiotemporal model (January 2013–December 2018). T1, T2, T3 and T4 represent the first, second, third and fourth trimester (quarter) of each year respectively.


