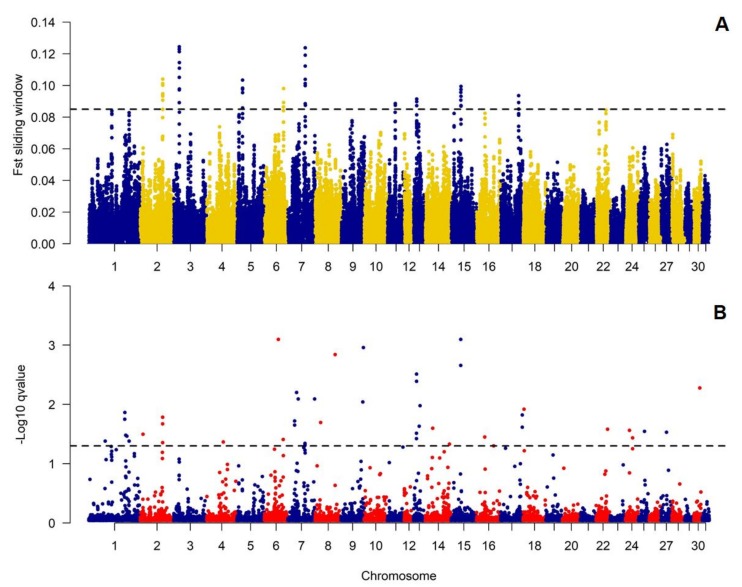
Figure 4.
Genome-wide distribution of diversifying selection signatures among Sokólski and Sztumski horses, (A) detected with sliding-window approach and (B) BayeScan software. In part A, sliding window-averaged FST values for individual SNPs are plotted against centered genomic positions of the windows. Dashed line shows threshold for the top 0.1% highest FST values (0.085). In part B, −log10 p-values are plotted. Dashed line indicates SNPs with p-value < 0.05.

