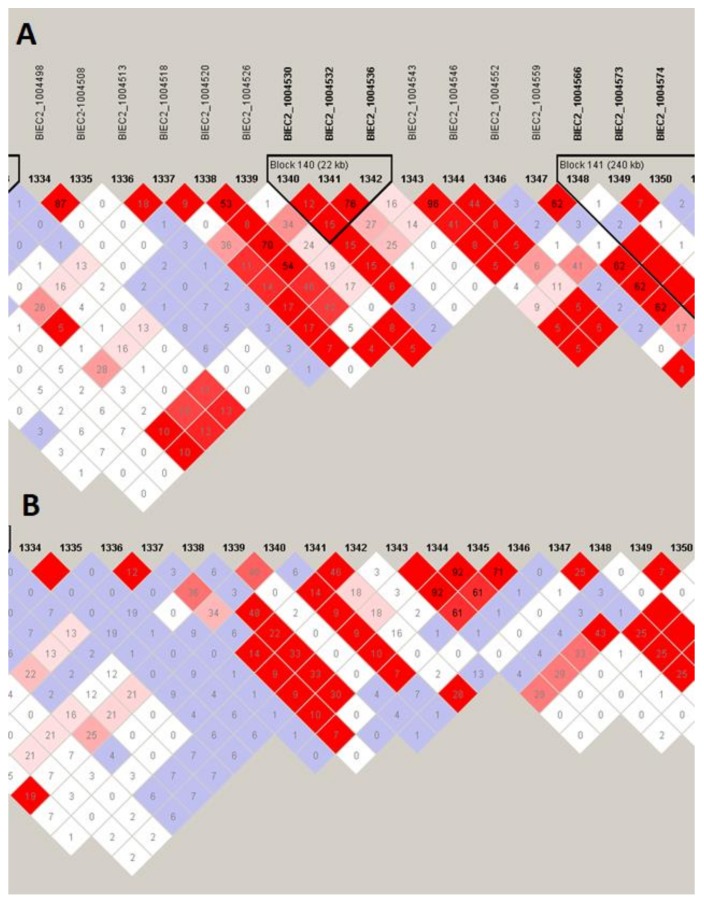
Figure 8.
Linkage disequilibrium and haplotype block structure directly at the region divergently selected on ECA7 between Sokólski (A) and Sztumski (B) horses. Names of SNPs and their successive numbering on chromosome are given at the top of the figure. Black triangles mark the haplotype blocks. The colored squares represent the pairwise SNP linkage disequilibrium. D’ = 1.00 in the blank red squares. Numbers inside the squares are r2 × 100. Detailed labeling of LD is described in Haploview manual [19].

