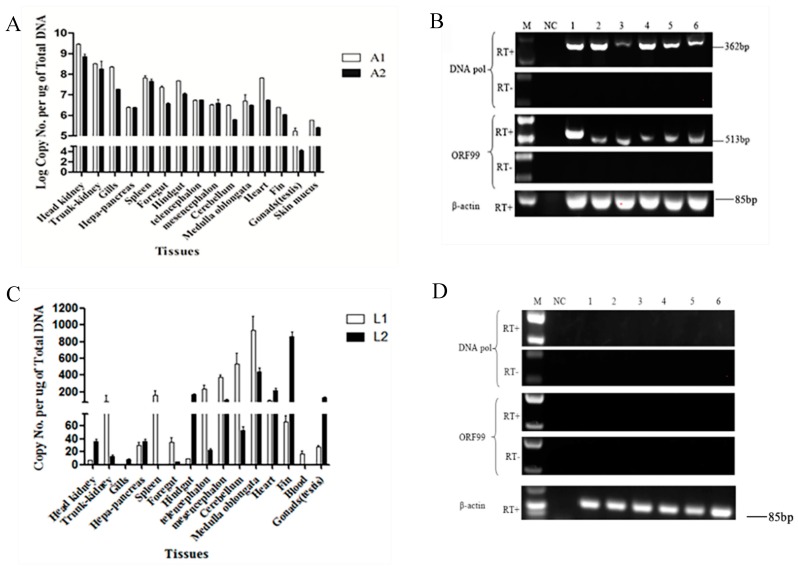
Figure 1.
Detection of CyHV-2 DNA and gene transcription from moribund fish or surviving fish after primary infection with CyHV-2: Quantification of the CyHV-2 DNA in tissues from moribund fish (A) or surviving fish (C) by qPCR. White bars and black bars represent two moribund fish A1 and A2 in panel A and two surviving fish in panel C, respectively. CyHV-2 DNA copies were calculated according to the standard curve based on the series of diluted plasmids containing the DNA polymerase gene and were expressed as copies per µg of total DNA (copies/µg DNA). Data in A and C are presented as the mean of triplicates ± SD of each tested tissue sample from two representative fish. RT-PCR analysis of total RNA harvested from moribund fish (B) or surviving fish (D) tissues after primary infection with CyHV-2 in the presence (RT+) or absence (RT-) of reverse transcriptase: The amplicons of DNA pol (362 bp) and ORF99 (513 bp) are indicated. Lanes 1 to 6 represent the tissue of head-kidney, gills, midbrain, medulla oblongata, heart, and spleen, respectively. The amplicons of β-actin gene are used as an internal control to ensure that comparable levels of input RNA were used in RT-PCR. One representative experiment of three is shown.

