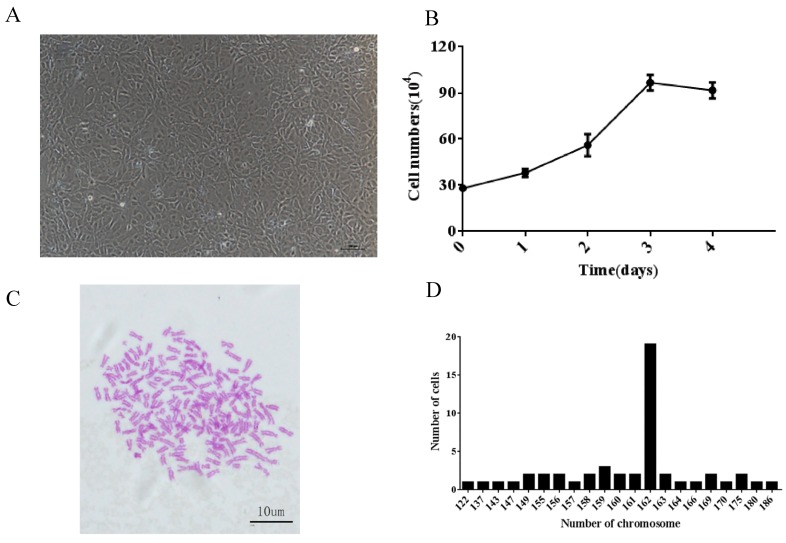
Figure 3.
Characteristics of the GCBlat1 cell line: (A) Morphology of GCBlat1 cells at passage 80. Scale bars = 100 μm. (B) Growth curves of the GCBlat1 cell line at passage 30 at 28 °C within 4 days. Y-axis represents cell numbers of the mean ± standard deviation of three independent experiments. (C) Morphological characteristics of chromosomes arrested in metaphase at passage 36. (D) Frequency distribution of chromosomes: The x-axis represents the number of chromosomes; the y-axis represents the number of cells analyzed.

