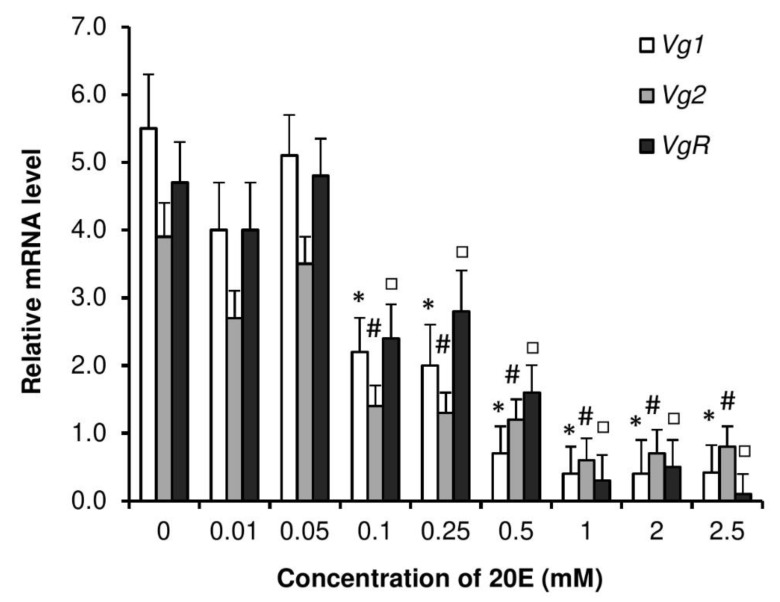
Figure 9.
Dose response for reduction by 20E. Expression of Vg1, Vg2, and VgR mRNA in P. americana female fat body 4 days after injection with 10 µL of the different doses of 20E. Control roaches were injected with 10 µL of ca. 0.1% EtOH solvent. Data are shown as mean ± SEM. Columns with symbols (*: Vg1; #: Vg2; □: VgR) are significantly different at p < 0.05, compared to 0 concentration, using Tukey’s test.

