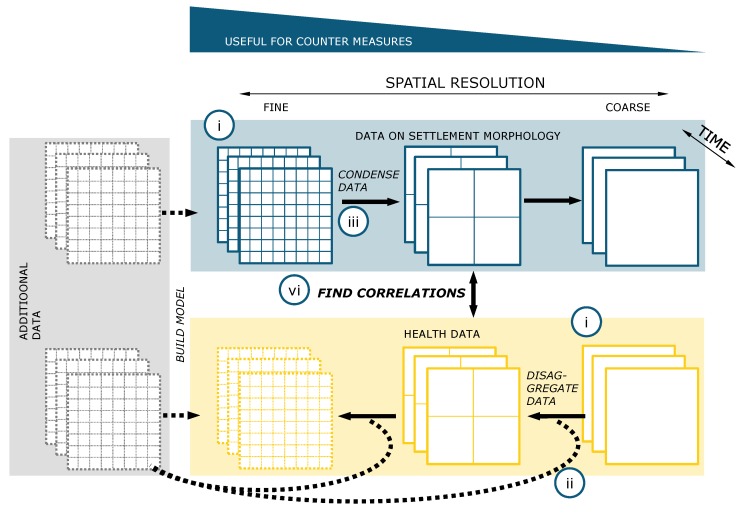
Figure 7.
Framework to investigate correlations between settlement (blue box) and health data (yellow box). Furthermore, it is possible to enrich the different settlement and health data with additional data to increase the resolution of the datasets. Examples of additional data are described in the text. Only three spatial resolutions are shown representatively, of course an unlimited number of intermediate levels is possible. The numbering in the blue circles shown in the figure is explained in detail in the text.

