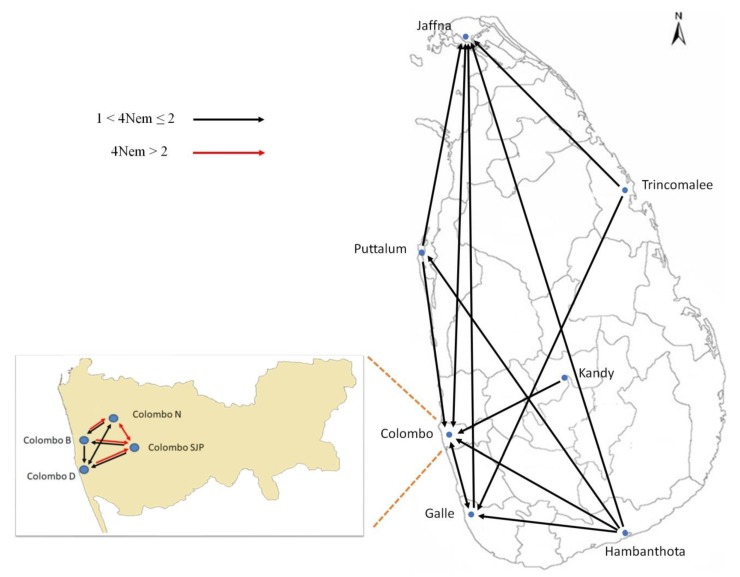
Figure 6.
Location of Ae. aegypti collection sites in Sri Lanka and estimated patterns of gene flow among these sites. Blue dots indicate the sampling sites and light gray lines indicate the district boundaries on the map. The arrows in the diagram indicate the rate (4Nem) and direction of the gene flow among the collection sites as estimated by MIGRATE-n 3.5.1. A significant migration rate is indicated by a black arrow where 4Nem > 1. A red arrow indicates 4Nem > 2, which is highly significant, and 4Nem < 1 is not indicated as it does not imply sufficient migration between the donor and the recipient populations to offset genetic drift. The inset shows the gene flow between the collection sites in Colombo.

