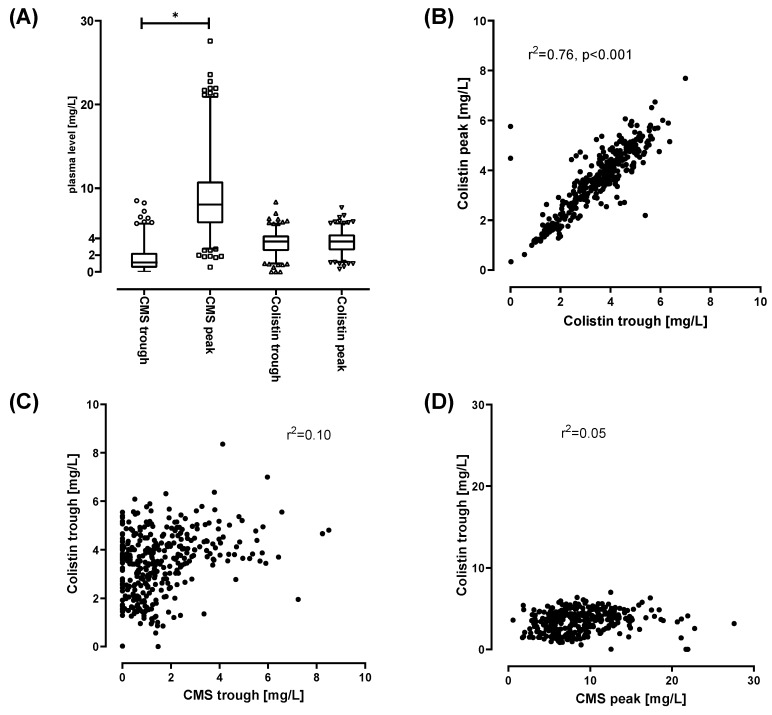
Figure 1.
(A): range of observed Colistimethate sodium (CMS) and Colistin levels of samples taken 30 min after injection (CMS and Colistin peak levels) or immediately prior to injections of CMS (CMS and Colistin trough levels). A total of 779 samples were analyzed (CMS peak n = 385, CMS trough n = 388, Colistin peak n = 388, Colistin trough n = 394). Box indicates 25–75th percentile including median. Whiskers indicate 2.5–97.5 percentile. Outliers are plotted individually. * p > 0.001 for t-test comparing CMS trough vs CMS peak levels. (B–D): Linear correlation (Pearson) of Colistin peak and trough levels (B) CMS trough and Colistin trough levels (C) and CMS peak versus Colistin trough levels (D).

