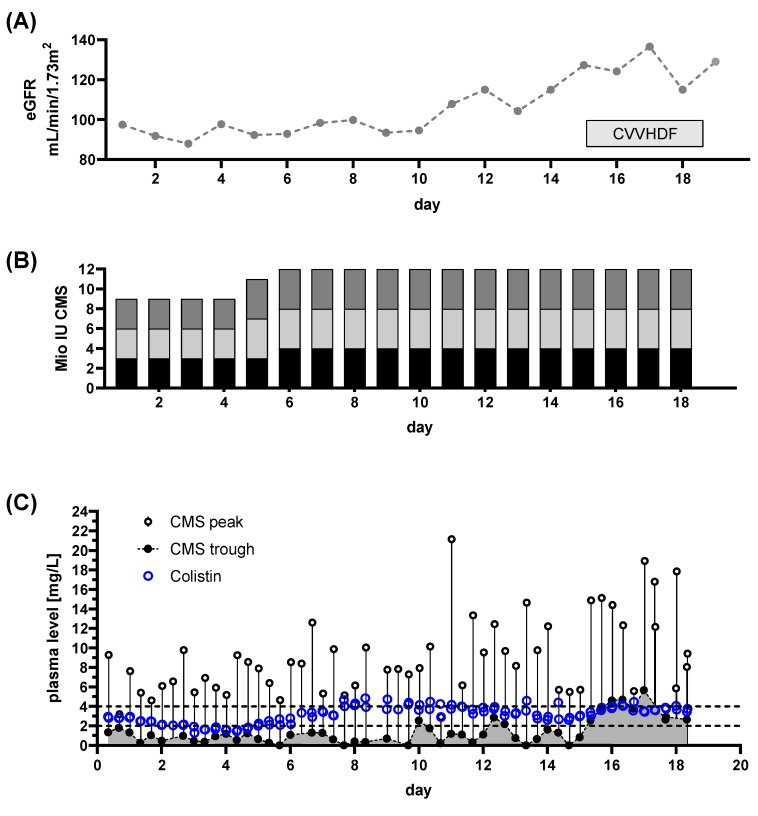
Figure 5.
Renal function, dose regimen and drug plasma levels of patient 3: a total of 105 samples were analyzed (colisthimethate sodium (CMS) peak n = 56, CMS trough n = 50, Colistin peak n = 54, Colistin trough n = 51). (A) estimated glomerular filtration rate (eGFR) derived from serum creatinine levels and renal replacement therapy via continuous venovenous hemodiafiltration (CVVHDF). (B) Dose regimen used. Shaded blocks depict the particular individual doses each day. (C) Time course of CMS trough and peak levels along with Colistin levels. The CMS reservoir is indicated by the area gray shaded portion of panel (C). Target range for Colistin plasma levels is indicated by dashed lines.

