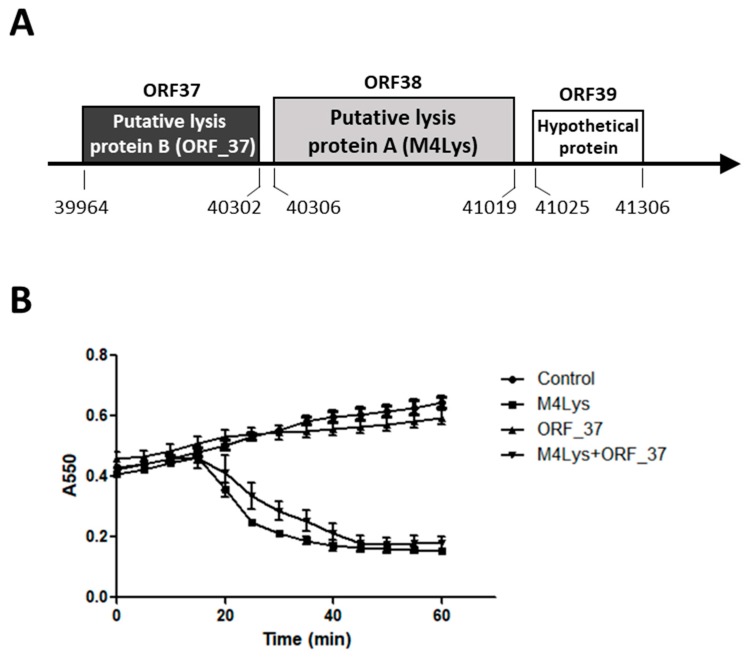
Figure 1.
Schematic representation of the phage BSPM4 lysis cassette and analysis of the lysis kinetics by its putative lysis proteins. (A) Schematic representation of the phage BSPM4 lysis cassette; (B) Growth kinetics of the E. coli strains producing the putative lysis protein A (M4Lys) and the putative lysis protein B (ORF_37). Closed circles, empty vector; closed triangles, production of ORF_37; closed squares, production of M4Lys; reverse closed triangles, co-production of ORF_37 and M4Lys. Lysis activity of each gene was investigated by 0.1 mM IPTG induction and the turbidity of the cells was observed. Experiments for the growth kinetics were performed in triplicate. The results of each treatment are represented by the mean ± standard deviation.

