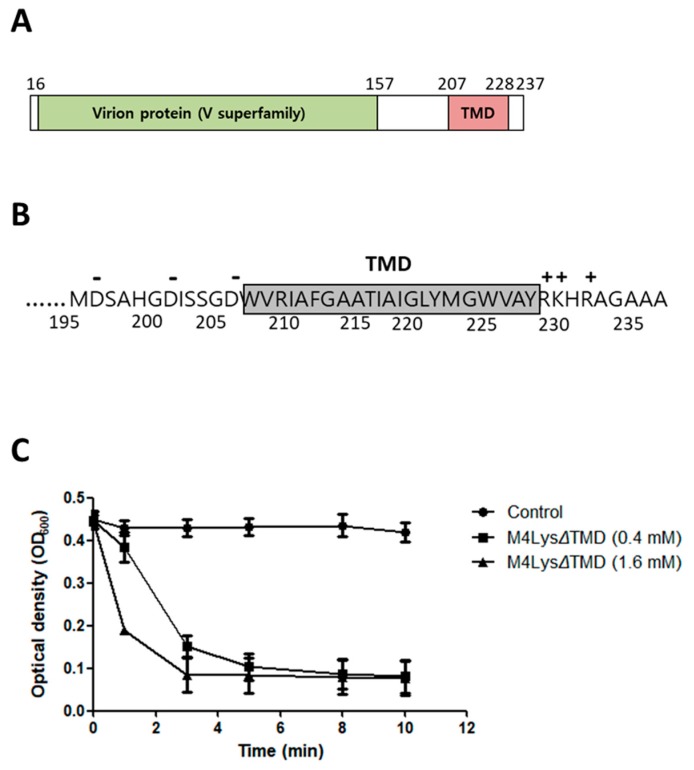
Figure 3.
Domain analysis of M4Lys and its peptidoglycan degradation activity. (A) Domain analysis of M4Lys. The numbers represent amino acid positions; (B) Charge distribution of the TMD region of M4Lys. Positive and negative charges are represented as + and -, respectively, above the amino acid sequences. Numbers under the amino acid sequences indicate amino acid position; (C) Turbidity reduction assay of purified M4LysΔTMD using E. coli peptidoglycan. Closed circles, buffer treatment (control); closed squares, 0.4 mM M4LysΔTMD treatment; and closed triangles, 1.6 mM M4LysΔTMD treatment. Turbidity reduction assays were performed in triplicate and the results of each treatment are represented by the mean ± standard deviation.

