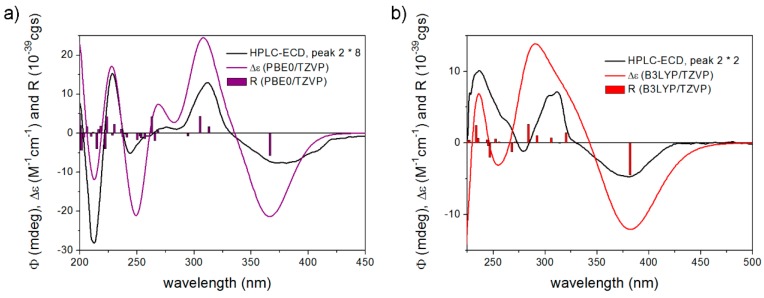
Figure 2.
(a) Experimental HPLC-ECD spectra of the second-eluting enantiomer of 10a (black line) compared with the PBE0/TZVP PCM/n-octanol spectrum of (S)-10a (purple line). (b) Experimental HPLC-ECD spectra of the second-eluting enantiomer of 11a (black line) compared with the B3LYP/TZVP PCM/n-octanol spectrum of (S)-11a (red line). Level of DFT optimization: CAM-B3LYP/TZVP PCM/n-octanol. Bars represent the computed rotational strength values.

