Fig. 1.
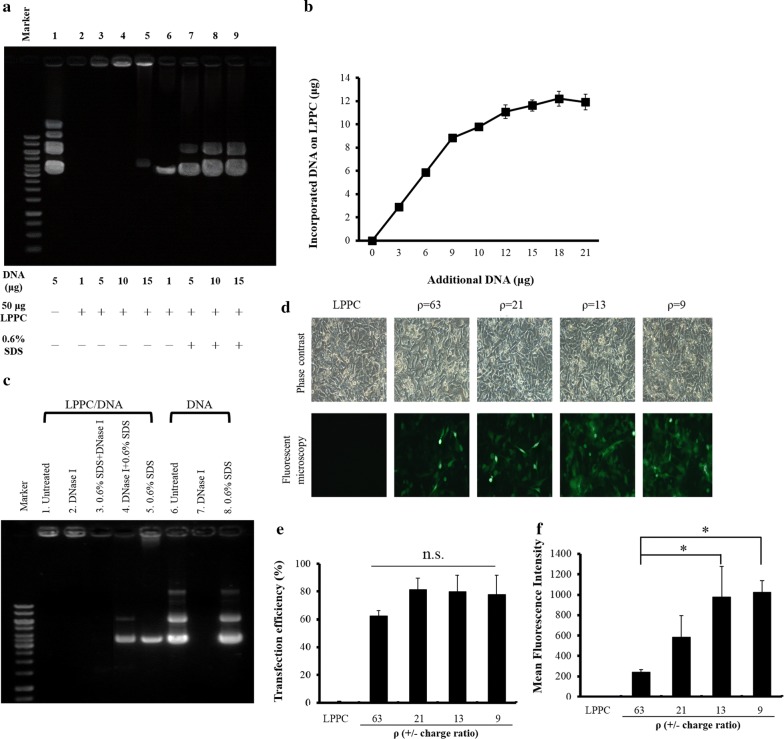
Characteristics of the LPPC/DNA complexes a LPPC (50 μg) was incubated with different amounts of DNA for 30 min at room temperature, and the complexes were determined by 0.8% agarose electrophoresis. Lane 1 was 5 μg DNA alone and lanes 2–5 were 1, 5, 10, and 15 μg DNA with LPPC, respectively. The replacement of DNA from the complexes by competition with 0.6% SDS is shown in lanes 6–9. b Different amounts of DNA were incubated with 50 μg of LPPC for 30 min at room temperature, and the amounts of bound DNA were analysed with a spectrophotometric assay. c The ability of LPPC to protect DNA from DNase I digestion was assessed by treatment with DNase I. Lane 1 was the LPPC/DNA complexes alone; lanes 2–5 were LPPC/DNA complexes treated with DNase I, SDS+ DNase I, DNase I+ SDS and SDS alone, respectively; and lanes 6–8 were DNA alone, DNA treated with DNase I, and DNA treated with SDS, respectively. d Different amounts of pAAV-MCS-hrGFP plasmids with 50 μg of LPPC at ρ = 63, 21, 13, 9 (± charge ratio) were transfected into B16-F10 cells, and the cells were observed under a microscope after 48 h. e, f Flow cytometry was used to analyse the transfection efficacy and the mean fluorescence intensity. The data represent the mean ± SD (n = 6). Significant differences were evaluated by ANOVA with the Bonferroni test and labelled as *P < 0.05

