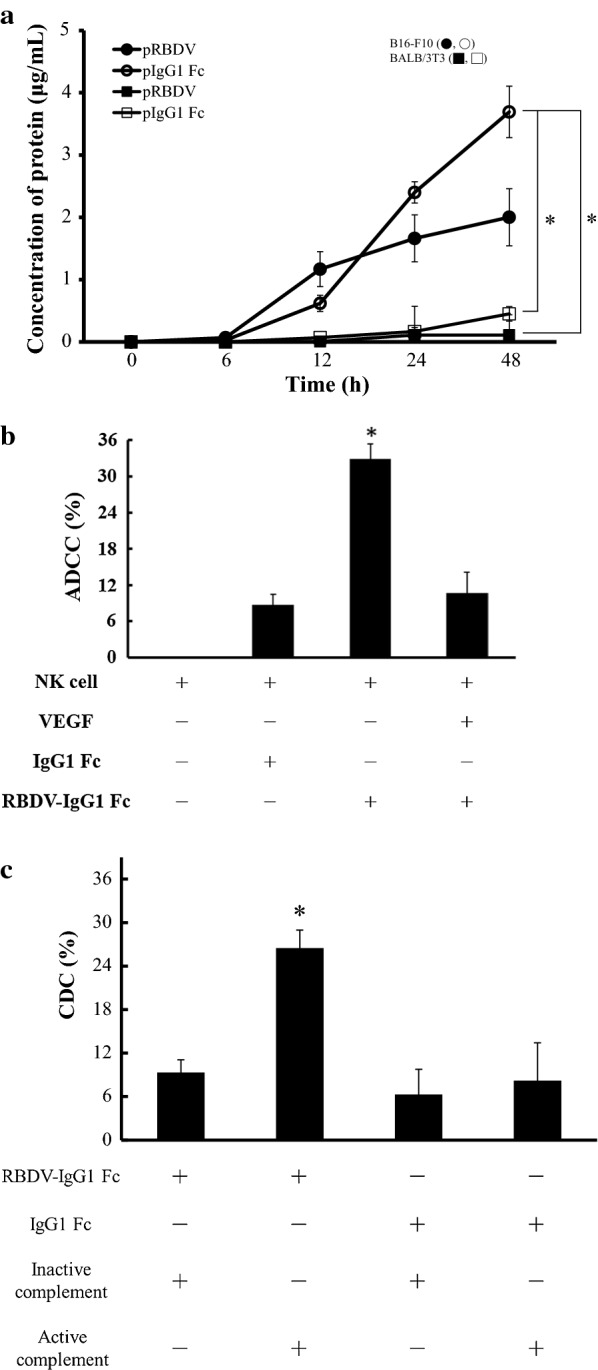
Fig. 4.

The expression of the RBDV protein and the in vitro cytotoxicity assay. a pRBDV or pIgG1 Fc were transfected into B16-F10 cells and BALB/3T3 cells. The black or white circles mean transfections of LPPC/pRBDV/RBDV/PEG or LPPC/pIgG1 Fc/RBDV/PEG in B16-F10 cells, respectively. The black or white squares mean transfections of LPPC/pRBDV/RBDV/PEG or LPPC/pIgG1 Fc/RBDV/PEG in BALB/3T3 cells, respectively. The cell culture media were analysed at 0, 6, 12, 24, and 48 h for the amount of protein expression by ELISA. LPPC, which encapsulated with RBDV, were all complexed by PEG. The data represent the mean ± SD (n = 3). Significant differences were evaluated by ANOVA with the Games-Howell test and labelled as *P < 0.05. b NK-92MI cells (effector cells) mixed with B16-F10 cells (target cells) at an E/T ratio of 1:1 were co-incubated with IgG1 Fc, RBDV-IgG1 Fc, or VEGF plus RBDV-IgG1 Fc for 5 h, and the cytotoxic activity was determined by MTT assay. The data represent the mean ± SD (n = 6). Significant differences were evaluated by ANOVA with the Bonferroni test and labelled as *P < 0.05 compared with other groups. c Complement mixed with B16-F10 cells was co-incubated with IgG1 Fc or RBDV-IgG1 Fc, and the cytotoxic activity was determined by MTT assay. The data represent the mean ± SD (n = 4). Significant differences were evaluated by ANOVA with the Bonferroni test and labelled as *P < 0.05 compared with other groups
