Figure 2.
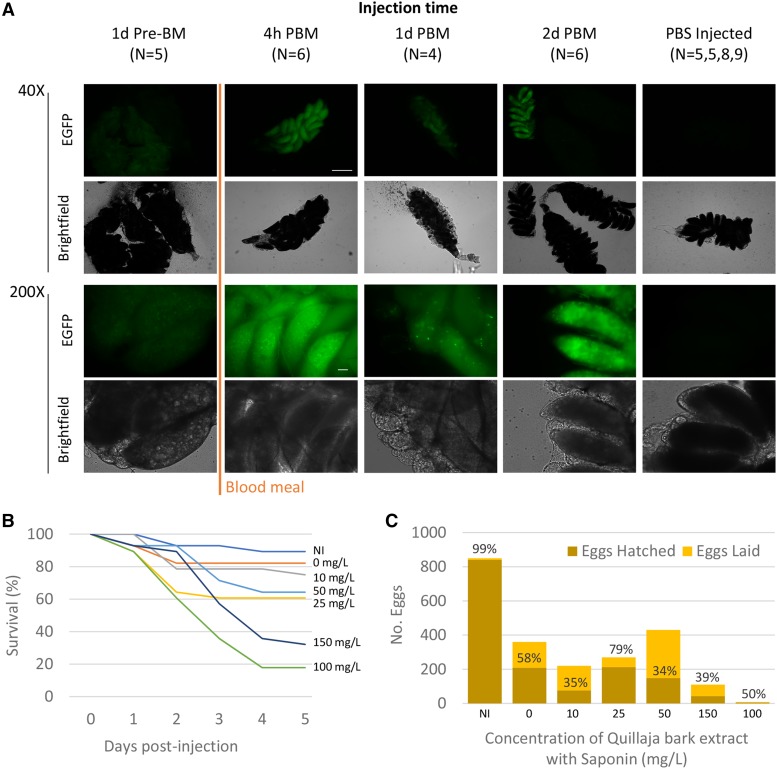
Optimization of injection components. A) Fluorescent and bright-field imaging of 72 hr (h) post-blood meal (PBM) ovaries following injection of P2C-EGFP at 1 day (d) before and 4 hr, 1 day and 2 days post-blood meal. Scale Bar represents 1mm in 40X images and 100uM in 200X images. B) Survival measurement following adult injections with different concentrations of Quillaja bark extract. C) Eggs and hatching counts from eggs laid by females injected with different concentrations of Saponin from Quillaja bark for endosome disruption. Percentages above bars represent the percentage hatching from eggs laid. Abbreviations are the same as Figure 1 and h: hour, N: number ovary pairs, pre-BM: before blood meal, PBS: phosphate buffered saline.

