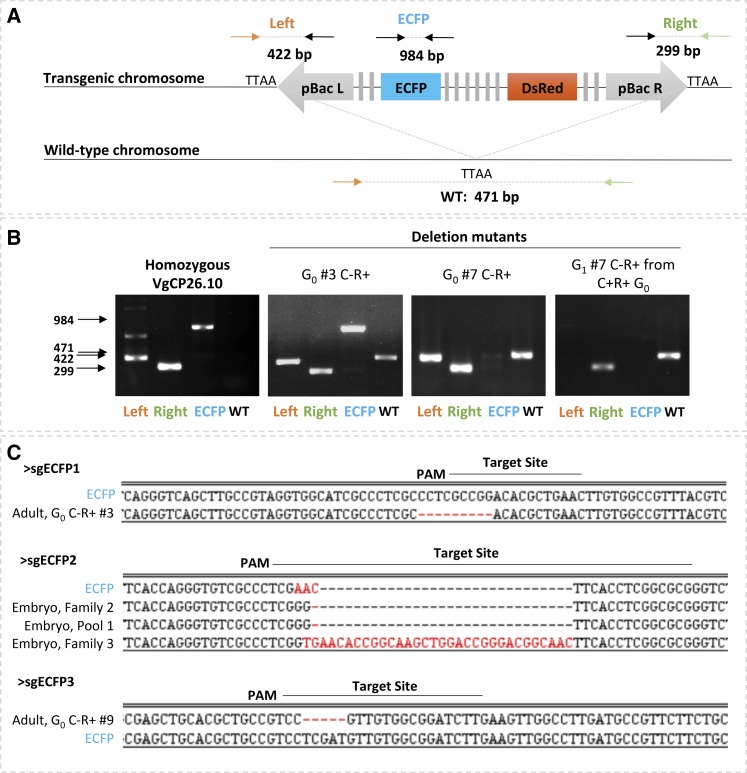
Figure 3.
Molecular characterization of ECFP negative G0 and G1 reveals both small and large deletions. A) Schematic of PCR strategy for mutant genotype characterization. Left and Right Primer sets produce amplicons of 422 and 299 base pairs, respectively, that confirm the presence of the transgene at the 26.10 genomic location. ECFP amplicon, 984 bp, spans all three target sites. Primers against genomic DNA (orange and green arrows) produce a 471bp diagnostic band from a non-transgenic chromosome. B) Representative gel images from individuals with intact transgene on both chromosomes (first panel), diagnostic amplicons for both transgenic and wild-type chromosome (second panel), amplicons diagnostic for a deletion that interrupts the primer binding site for ECFP amplification (third panel) and amplicons diagnostic for a deletion that interrupts primer sites for the ECFP amplicon and the Left amplicon (fourth panel). C) Alignments of small deletion mutants from both embryo and adult injections to ECFP. Abbreviations are the same as Figure 1 and WT: wild-type, C: cyan, R: Red, PAM: protospacer motif.

