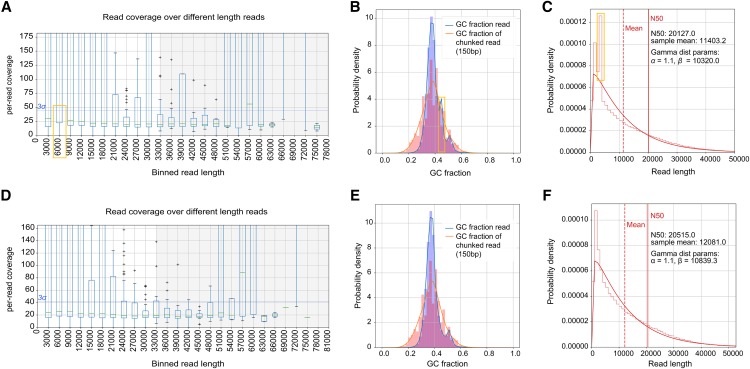
Figure 2.
Effects of E. coli filter on ONT A. thaliana dataset. Top panels were generated from the original dataset and bottom panels show plots after E. coli read removal. (A, D) Distribution of per-read coverage. (B, E) GC content distributions. (C, F) Length distributions. Yellow boxes highlighted the spikes that disappeared after E. coli read removal.

