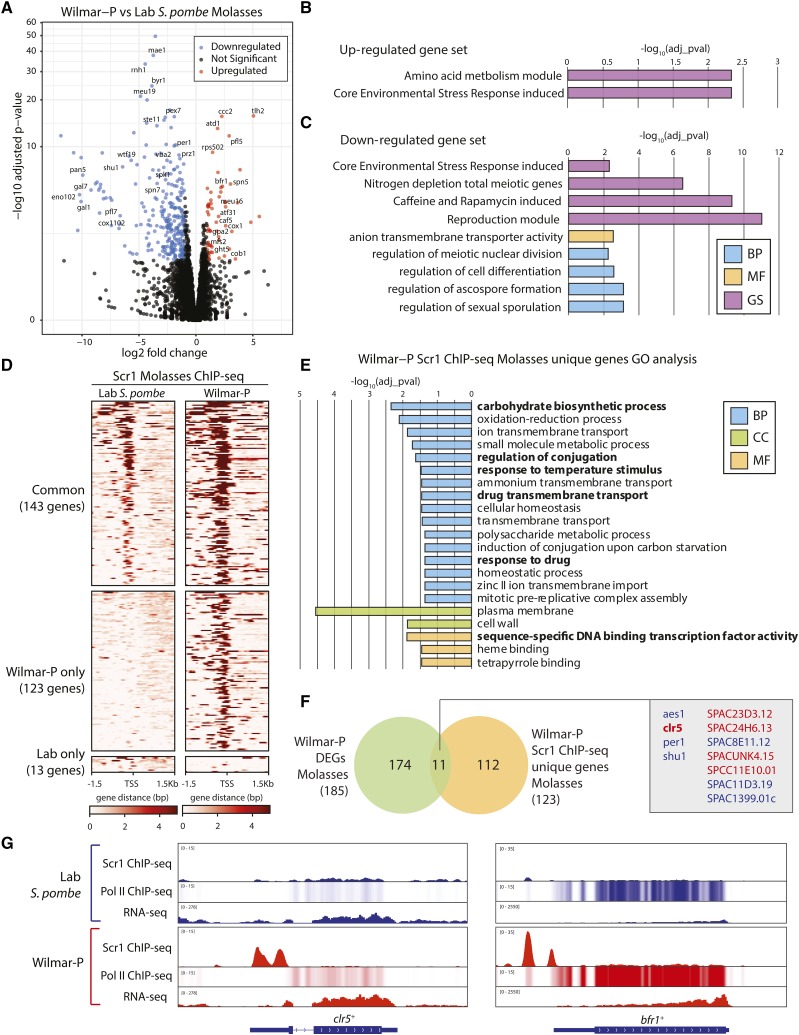
Figure 7.
Wilmar-P installs a stress-tolerant transcriptional profile on molasses through the repurposing of Scr1 function. A) Volcano plot of differential gene expression in Wilmar-P vs. laboratory S. pombe on molasses. Genes of interest are labeled. Gene ontology and gene set enrichment analysis for the genes significantly upregulated (B) and downregulated (C) in Wilmar-P on molasses. BP = Biological process, MF = Molecular function, GS = Angeli gene set. D) Global heatmap of Scr1 ChIP-seq enrichment across gene transcription start sites (TSS) +/− 1.5kb in laboratory S. pombe and Wilmar-P in the molasses condition. Heatmap split by regions showing Scr1 binding in both strains (common), Wilmar-P only, or laboratory S. pombe only. E) Significantly enriched GO terms for the protein-coding genes bound by Scr1 only in Wilmar-P. BP = Biological process, CC = Cellular component, MF = Molecular function. F) Venn diagram showing overlap of genes significantly differentially expressed in Wilmar-P vs. laboratory S. pombe on molasses with protein-coding genes bound by Scr1 only in Wilmar-P. Genes within the overlap are labeled as upregulated (red) or downregulated (blue) in Wilmar-P. G) Genome browser views of Scr1 and PolII enrichment and RNA-seq normalized read coverage at the clr5+ and bfr1+ loci in laboratory S. pombe (blue) and Wilmar-P (red).

