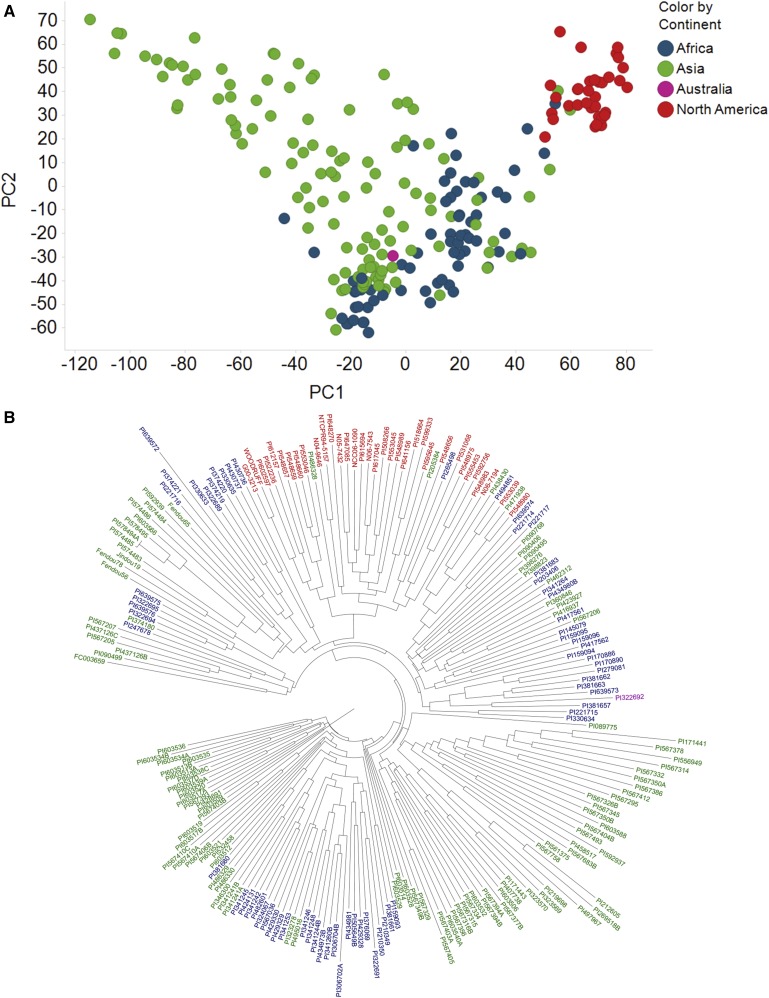
Figure 2.
(A) Plot of first and second principal coordinates for a diverse panel of soybean accessions evaluated in drought tolerance related studies. Each individual soybean genotype is colored by their continent of origin. (B) Dendrogram using neighbor joining clustering algorithm in TASSEL visualized in FigTree. Genotypes are colored by their continent of origin: red = North America, blue = Africa, green = Asia, and purple = Australia.

