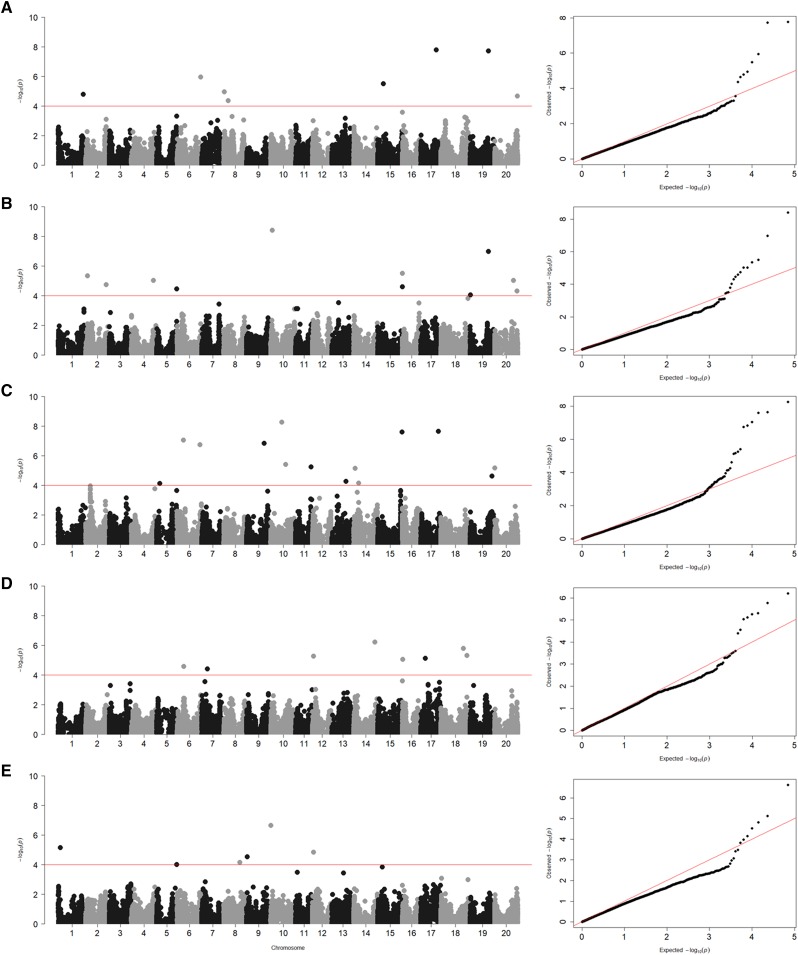
Figure 3.
Genome-wide Manhattan plots for (A) ALL, (B) GA-15, (C) GA-16, (D) KS-15, and (E) KS-16. The X-axis is the genomic position of SNPs by chromosome across the soybean genome, and the Y-axis is the -log10 of the p-values obtained from the GWAS model. Significance threshold -log10(P) > 4 (red line). The quantile-quantile (QQ) plots to the right of each Manhattan plot show the expected vs. observed p-values of each SNP tested in the GWAS models.

